
説明
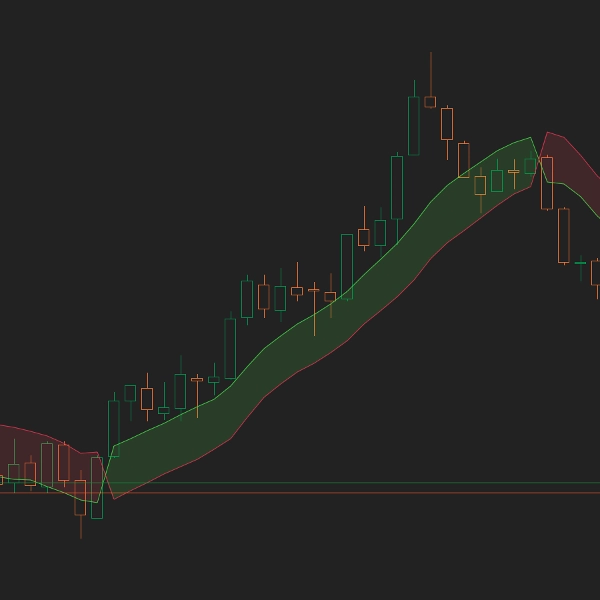
市場の方向性に迷っていますか?SSLチャネルは二重移動平均を使用してトレンドの明確な視覚的表現を作成します。緑の雲は買い、赤の雲は売りを意味します。純粋でシンプル、効果的です。
主な特徴
- 二重MAトレンド検出:高値と安値に別々の移動平均を使用してトレンド方向を判断し、単一MAシステムの曖昧さを排除します
- 視覚的なクラウド確認:半透明のクラウドがブルとベアのライン間のスペースを埋め、現在のトレンド状態を即座に視覚的に確認できます
- スマートカラー論理:終値が高いMAを上回るとブルは緑色になり上部に移動します。終値が低いMAを下回るとベアは赤色になり上部の位置を取ります
- オプションのアラート:ブルとベアのラインが交差したときにポップアップ通知とサウンドアラートを有効にして、潜在的なトレンド変化を知らせます
- 複数のMAタイプ:シンプル、指数平滑、スムーズ、加重など、取引スタイルに合わせて移動平均の種類を選択できます
仕組み
SSLチャネルは2つの移動平均を計算します:高値に1つ、安値に1つ。インジケーターは現在の終値をこれらのレベルと比較します:
- 強気トレンド:終値 > 高いMAのとき、ブルのライン(緑)が上部に移動し、ベアのライン(赤)が下部に移動します
- 弱気トレンド:終値 < 低いMAのとき、ベアのライン(赤)が上部に移動し、ブルのライン(緑)が下部に移動します
これらのライン間のクラウドはトレンドを視覚的に強調し、上部の色付きラインの方向に取引することで最も高い確率のセットアップが得られます。
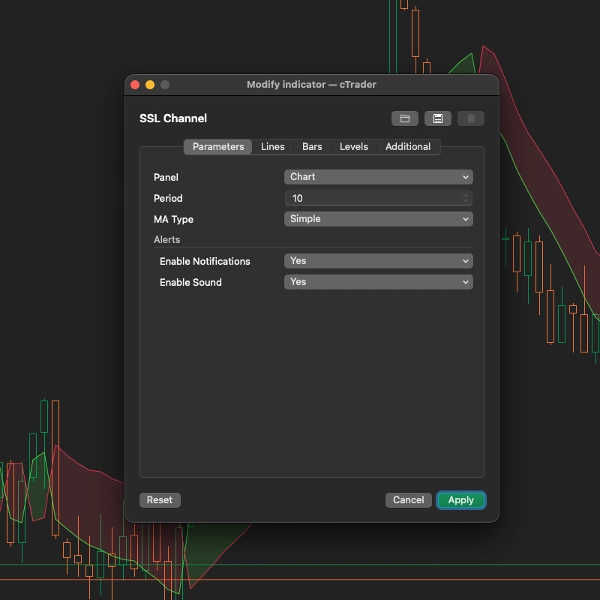
パラメーター
- 期間 (デフォルト: 10):移動平均計算のバー数。低いほど反応が速く、高いほど信号が滑らかになります
- MAタイプ (デフォルト: シンプル):移動平均の計算方法を選択します - シンプル、指数平滑、スムーズ、加重、またはその他の利用可能なタイプ
- 通知を有効にする (デフォルト: 偽):ラインが交差したときにポップアップアラートを表示します
- サウンドを有効にする (デフォルト: 偽):ラインが交差したときに音を再生します
対象
- 明確で曖昧さのないシグナルを求めるトレンドトレーダー
- ブレイクアウトやプルバック戦略を使うトレーダー
- 画面を見続けるよりも視覚的なチャートベースの取引を好む人
- 既存のシステムにシンプルなトレンドフィルターを求める人
取引のヒント
- トレンドフィルター: ブル(緑)が上にあるときのみロングトレードを行い、ベア(赤)が上にあるときのみショートトレードを行います
- プルバックエントリー: 価格がクラウドに戻るのを待ってからトレンド方向にエントリーします
- クロスオーバーシグナル: ブルとベアのラインの交差はトレンド変化を示し、エントリーまたはエグジットのシグナルとして使用します
- タイムフレーム: スキャルピング用のM15からスイングトレード用のH4/D1まで対応します
プロのヒント
- 確認のために出来高と組み合わせて使用してください。高い出来高でのクロスオーバーはより信頼性があります
- サポート/レジスタンスレベルと併用して、より高確率のエントリーを狙いましょう
- 期間パラメーターは銘柄ごとに最適化可能です。取引する各ペアで異なる値をテストしてください
概要
AIによる概要
The SSL Channel is a trend-following indicator designed for scalpers and day traders seeking clear, early signals of market direction changes. It uses two moving averages—one calculated on highs and another on lows—to define bullish and bearish trends. When the closing price is above the high moving average, the indicator displays a green "Bulls" line on top and a red "Bears" line below, signaling an uptrend. Conversely, when the close is below the low moving average, the red "Bears" line moves to the top and the green "Bulls" line to the bottom, indicating a downtrend. A semi-transparent cloud fills the space between these lines, providing an immediate visual confirmation of the current trend.
Traders can customize the moving average type (Simple, Exponential, Smoothed, Weighted) and the period length to suit their trading style. Optional popup and sound alerts notify users of line crossovers, marking potential trend shifts. The SSL Channel supports multiple markets including Forex, indices, and cryptocurrencies, and is suitable for use on timeframes from 15 minutes to daily charts. It can be used standalone or combined with other systems for confirmation, aiding in breakout, pullback, and trend-following strategies. The indicator is simple to apply—just add it to the chart, adjust settings, and trade accordingly.
Traders can customize the moving average type (Simple, Exponential, Smoothed, Weighted) and the period length to suit their trading style. Optional popup and sound alerts notify users of line crossovers, marking potential trend shifts. The SSL Channel supports multiple markets including Forex, indices, and cryptocurrencies, and is suitable for use on timeframes from 15 minutes to daily charts. It can be used standalone or combined with other systems for confirmation, aiding in breakout, pullback, and trend-following strategies. The indicator is simple to apply—just add it to the chart, adjust settings, and trade accordingly.
インジケーターのプロフィール
カスタマーレビュー
5.0
レビュー: 1
5 | 100 % | |
4 | 0 % | |
3 | 0 % | |
2 | 0 % | |
1 | 0 % |
ディスカッション
よくあるご質問
BTCUSD
Forex
Breakout
Scalping
Indices
EURUSD
GBPUSD
NZDUSD
Crypto
XAUUSD
NAS100
USDJPY
cTrader Storeで入手可能な取引ボット、インジケーター、プラグインなどの商品は、第三者の開発者が提供するものであり、情報と技術の取得のみを目的としてご利用いただけます。cTrader Storeはブローカーではなく、投資助言や個人的な推奨を行うことも、将来のパフォーマンスを保証することもありません。


![「[Stellar Strategies] Market Session Ultimate」ロゴ](https://cdn.ctrader.com/image/webp/61ffd537-0125-4246-9e72-42eca1791d64_28232)


![「[Stellar Strategies] MARSI Signal Plotter」ロゴ](https://cdn.ctrader.com/image/webp/7b2b8da6-8f8e-4646-8d4a-4710c516c01e_25567)


価格
登録日 04/04/2025
8
販売
1.95K
無料インストール