
present
新規登録で初回購入時に$50オフ
Trading product for Market Bias Dashboard インジケーター Premium/Discount  Key Levels, image 1
Market Bias Dashboard
インジケーター
バージョン 1.0、Jul 2026
Windows、Mac
Trading product for Market Bias Dashboard インジケーター Premium/Discount  Key Levels, image 2
Trading product for Market Bias Dashboard インジケーター Premium/Discount  Key Levels, image 3
Trading product for Market Bias Dashboard インジケーター Premium/Discount  Key Levels, image 4

説明

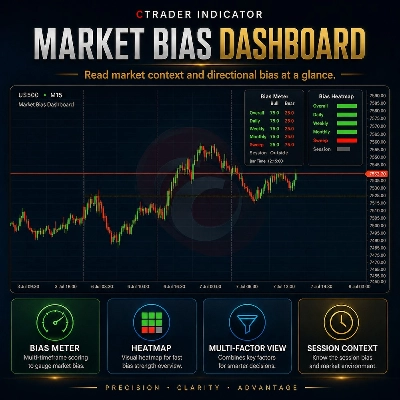
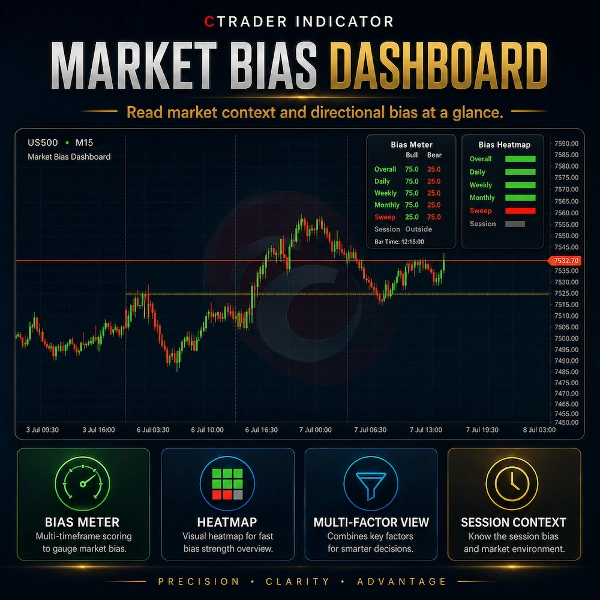
Market Bias Dashboardは、チャート上で市場の状況を直接要約するために設計された視覚的なcTraderインジケーターです。


ダッシュボードは、前日、前週、前月の均衡レベル、現在のセッション状況、および最新の検出された流動性スイープなどの選択されたプライスアクションの参照ポイントを評価します。結果は、クリーンなバイアスメーターとバイアスヒートマップのレイアウトで表示されます。


重要:表示されるブル/ベアの値は、統計的確率、ライブ市場センチメントデータ、または取引の勝率予測ではありません。これらはダッシュボードを読みやすくするために使用される固定された視覚的コンテキスト状態です。


ダッシュボードは以下の状態ロジックを使用します:


強気のコンテキスト:75 / 25

中立または混合のコンテキスト:50 / 50

弱気のコンテキスト:25 / 75


例えば、価格が選択された均衡レベルの上にある場合、その要素は強気のコンテキストとして表示されることがあります。価格がその下にある場合は、弱気のコンテキストとして表示されることがあります。コンテキストが不明確、利用不可、または混合の場合は、中立として表示されることがあります。


主な特徴:

- クリーンなバイアスメーターパネル

- バイアスヒートマップパネル

- 前日、週、月のCEコンテキスト

- プレミアム/ディスカウントコンテキストビュー

- 現在のセッション状況

- オプションの流動性スイープコンテキスト

- オプションの参照線

- 調整可能なパネル位置

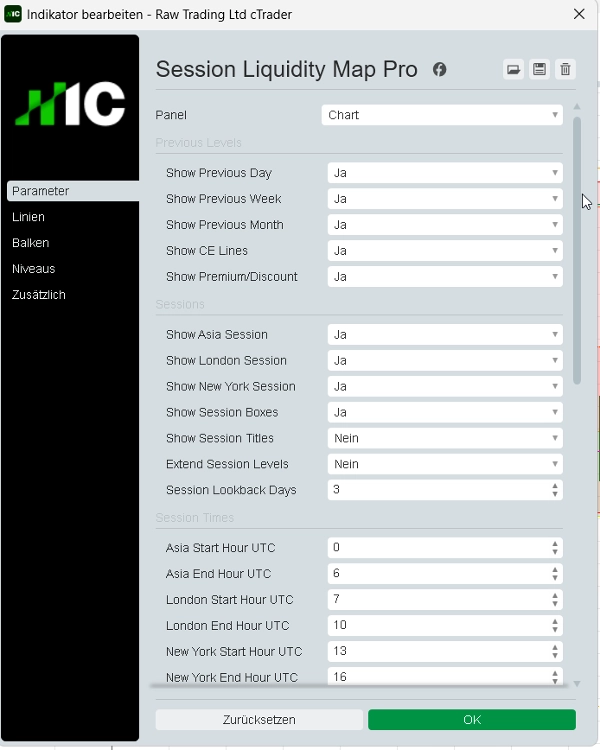
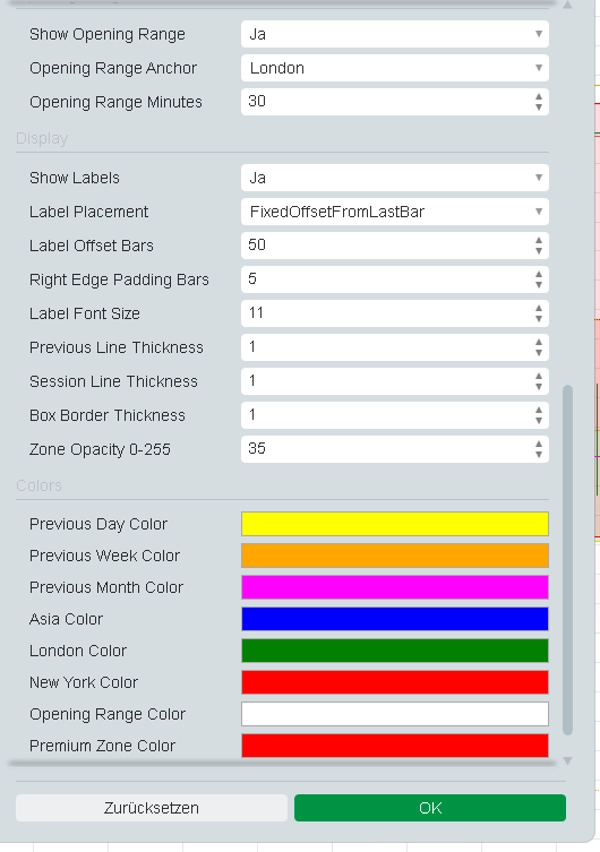
- カスタムカラーと表示設定

- 制限されたアクセス権を持つストアセーフインジケーター


Market Bias Dashboardはチャートの視覚化および市場コンテキストツールに過ぎません。取引を実行せず、注文を変更せず、保証された買いまたは売りのシグナルを提供しません。


取引にはリスクが伴います。このインジケーターは金融アドバイス、投資推奨、統計的確率、または保証された取引結果を提供しません。

概要

AIによる概要
Market Bias Dashboard is a cTrader indicator that visually summarizes market context on your chart. It evaluates key price action reference points including previous day, week, and month equilibrium levels, current session status, and recent liquidity sweeps. These elements are presented through a Bias Meter and Bias Heatmap, indicating bullish, bearish, or neutral market states based on price positioning relative to equilibrium levels. The dashboard’s bias states use fixed visual values (bullish: 75/25, neutral: 50/50, bearish: 25/75) to simplify interpretation and do not represent probabilities or trading signals. Features include premium/discount context views, optional liquidity sweep indicators, adjustable panel positioning, customizable colors and display settings, and reference lines. The tool is designed solely for market context visualization and does not execute trades or provide financial advice. It supports analysis of trend strength and reversal signals using bar data and is categorized under trend indicators. Tags associated with the product highlight its focus on structure and smart money concepts such as key levels, liquidity grabs, and risk dashboards.
インジケーターのプロフィール
インジケーターのカテゴリー
トレンド
出力の種類
ビジュアル表示
データ要件
バーのみ
サポート対象のシグナル
反転
トレンドの強さ

カスタマーレビュー

0.0
レビュー: 0
カスタマーレビュー
この商品にはまだレビューがありません。お使いになったことがある方は、ぜひレビューをお願いします。

ディスカッション

よくあるご質問

Premium/Discount
Key Levels
Liquidity Sweep
Risk Dashboard
Liquidity Grab
cTrader Storeで入手可能な取引ボット、インジケーター、プラグインなどの商品は、第三者の開発者が提供するものであり、情報と技術の取得のみを目的としてご利用いただけます。cTrader Storeはブローカーではなく、投資助言や個人的な推奨を行うことも、将来のパフォーマンスを保証することもありません。

この作成者の他の商品

インジケーター
SMC
Prop
+5
Automatically draws the Opening Range (High & Low) for Tokyo, London, and New York sessions. Configurable start times,
インジケーター
Liquidity Grab
Liquidity Sweep
+2
Visualizes accumulation ranges, manipulation sweeps and distribution phases on your cTrader chart.
インジケーター
BOS
Key Levels
+2
Maps bullish and bearish order block zones, CE levels and structure-based price action context.
インジケーター
MSS
Key Levels
+2
Maps equal highs, equal lows and active liquidity pools directly on your cTrader chart.
インジケーター
BOS
MSS
+3
Maps BOS, CHoCH, swing breaks and market structure shifts directly on your cTrader chart.
インジケーター
EMA
RSI
+2
Compact premium cTrader dashboard for market bias, sessions, premium/discount context, liquidity direction, ADR range an
cBot
ATR
EMA
+4
Professional Supply & Demand Execution Bot for cTrader. CS Apex Hunter Pro is a fully automated execution bot designed
7.6%
ROI
3.17
プロフィットファクター
インジケーター
SMC
Prop
+12
Killzone, ICT, SMC, Session, Asia, London, New York, NY PM, Session High, Session Low, Smart Money, Order Flow, Trading
インジケーター
MSS
Key Levels
+4
Maps session ranges, previous highs/lows, equilibrium and premium/discount zones on your cTrader chart.

これも好きかも

インジケーター
Forex
Crypto
+4
Spot powerful 3-candle reversal patterns like Morning/Evening Star and Soldiers/Crows at key swing highs and lows
インジケーター
RSI
Breakout
+1
"Identify key market zones and visualize support/resistance from multiple timeframes on a single chart.
インジケーター
RSI
MACD
+1
Precision Supply & Demand zones indicator—automatically plots key buy/sell areas on your chart for smarter entries.
インジケーター
Prop
Forex
+13
Volume Meter
インジケーター
ATR
Channel
+1
Bollinger Bands Advanced Squeeze & Breakout System, Real-Time On-Chart Dashboard, Auto-Squeeze Detector, Dual-Band Cloud
「IVB 2.0」ロゴ
トップ評価
4.6
(5)
$19
インジケーター
IVB 2.0 is an indicator that works on the strategy of imbalance of the maximum volatility box of indices
インジケーター
Prop
Scalping
Shows bars from different Time Frame on zoom out and hides the current bars. Perfect tool for Multi TF "Market Reply"
インジケーター
ATR
EMA
+5
The indicator displays potential reversal zones (support/resistance) on the chart based on the average range (High–Low)
インジケーター
Auto-detect supply & demand zones, remove broken levels, and trade smarter with real-time alerts. Precision made simple.
インジケーター
Key Levels
Support & Resistance
Draws a colored High/Low/Open/Close box for any custom time range you set — trade breakouts & retests.
「Stochastic RSI PRO」ロゴ
トップ評価
4.6
(6)
$28
/
$40
インジケーター
RSI
Prop
+14
Unlock Stochastic RSI PRO in cTrader! Overlay RSI, highlight zones, and identify divergences with customizable settings.
インジケーター
ATR
Volume
+4
Advanced broker tick-volume profile with estimated POC, VAH/VAL, estimated HVN/LVN and session/lookback context.
インジケーター
VWAP
Volume
+5
The MA Quant Volume Profile Custom Range is a trading indicator that analyzes volume distribution across the price.
インジケーター
Crypto
Signal
+3
Candlestick Signal Finder: cTrader indicator that automatically detects and color-codes key Japanese candlestick pattern
インジケーター
ATR
RSI
+6
💹 Define a price channel 📈 and determine trend direction (bullish 🟢 or bearish 🔴).
インジケーター
Volume
Fibonacci
+3
Draw and manage multiple fixed-range volume profiles with persistent levels, developing POC/VA and smart alerts.
インジケーター
A compact, visual multi-timeframe trend indicator for cTrader. Easily spot bullish or bearish trends across 4 customizab
インジケーター
BOS
CHOCH
+3
Identifies HH, HL, LH, and LL swing points using fractals. Essential for Smart Money Concepts and price action.

価格

4
販売

























