

present
Zarejestruj się i otrzymaj 50 $ zniżki na pierwszy zakup
Produkty dostępne za pośrednictwem cTrader Store, w tym boty handlowe, wskaźniki i wtyczki, dostarczane są przez deweloperów zewnętrznych i udostępniane wyłącznie w celach informacyjnych oraz w celu zapewnienia dostępu technicznego. cTrader Store nie jest brokerem i nie zapewnia doradztwa inwestycyjnego, nie udziela spersonalizowanych rekomendacji ani nie gwarantuje przyszłych wyników.

Więcej od tego autora

Automatically draws the Opening Range (High & Low) for Tokyo, London, and New York sessions. Configurable start times,
Visualizes accumulation ranges, manipulation sweeps and distribution phases on your cTrader chart.
Maps bullish and bearish order block zones, CE levels and structure-based price action context.
Maps equal highs, equal lows and active liquidity pools directly on your cTrader chart.
Maps session ranges, previous highs/lows, equilibrium and premium/discount zones on your cTrader chart.
Maps BOS, CHoCH, swing breaks and market structure shifts directly on your cTrader chart.
Compact premium cTrader dashboard for market bias, sessions, premium/discount context, liquidity direction, ADR range an
Professional Supply & Demand Execution Bot for cTrader. CS Apex Hunter Pro is a fully automated execution bot designed
7.6%
ROI
3.17
Współczynnik zysku

Możesz także polubić

Identify bullish and bearish Order Blocks to spot key support/resistance levels and potential trend reversals! 📈🔄
Full ICT/SMC 4-step setup checker that alerts a long or short setup.
Grades ICT Unicorn setups (Breaker Block + FVG confluence) into PRIME / SETUP / WATCH, with retest & RR targets.
The Break of Structure (BoSCHoCh) Indicator is a smart market structure tool designed to help traders easily spot trend.
CPR indicator that actually predicts the day ahead: width percentile scoring for breakout-day detection
WinSMC is an overlay SMC indicator for cTrader. It helps you visually identify!
Jurik Moving Average (Jurik's Moving Average) triple adaptive filter with unique Jurik smoothing and dynamic factor.
20/40/60-day IPDA lookback ranges, Premium/Discount/Equilibrium zones, and quarterly shift alerts — anchored to true dai
Identifies trends with moving averages & volatility. Base levels = bullish 🐂 or bearish 🐻 signals. Reversals detected!
🌊 See when the market is truly in play. Tsunami measures Relative Volume by time-of-day 🌊
The standard Relative Strength Index (RSI), RSI & Signal Cloud, Smart Volatility Filter (ATR), On-Chart Info Dashboard
Session boxes with UTC offset, OR logic, adjustable opacity, and multi-day lookback.
Identifies institutional zones with Volume Delta (K) across any asset or chart for high-precision entry detection.
Logo „Stochastic RSI PRO”
Najwyżej oceniane
4.7
(4)
$28
/
$40
Unlock Stochastic RSI PRO in cTrader! Overlay RSI, highlight zones, and identify divergences with customizable settings.
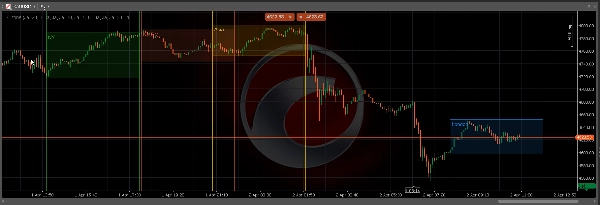
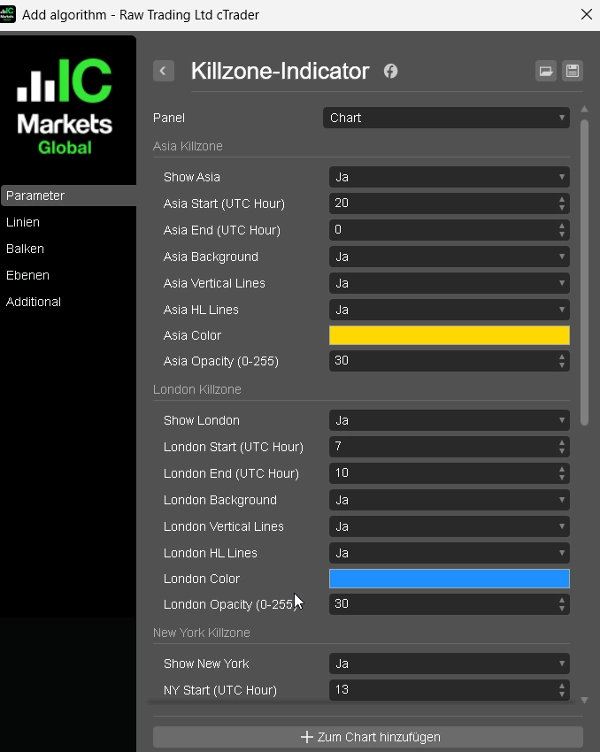
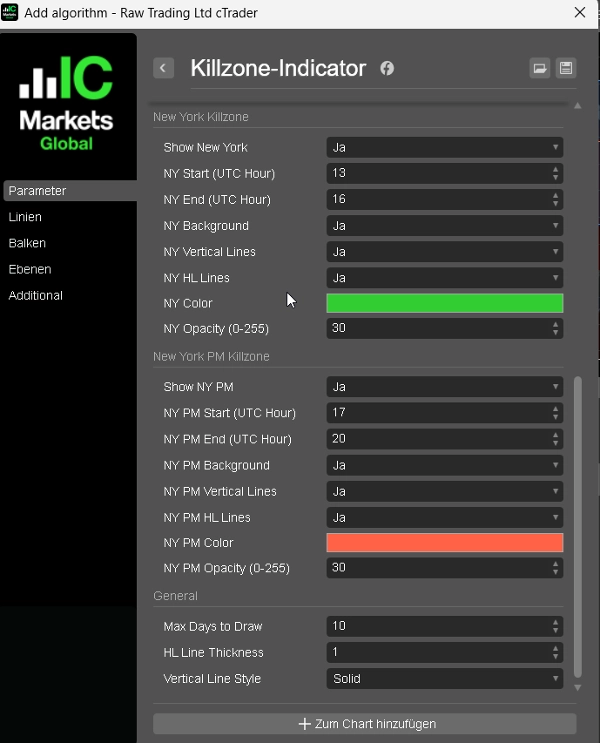
Complete ICT Killzones: 5 sessions, easy colors, transparency controls & session info. Professional timing for cTrader.
The traditional Hull Moving Average with different colours based on the slope (direction) of the trend.
Dynamic circles visualize price's volatility position. Like RSI for market overextension & stretch. Quantify context.
Buy and Sell Signals

Cena

























