Wskaźnik
NAS100
NZDUSD
XAUUSD
Commodities
Forex
EURUSD
GBPUSD
BTCUSD
Indices
Prop
Stocks
Crypto
USDJPY
Tsunami Volume Surge - RVOL
Logo „Tsunami Volume Surge - RVOL”
02/10/2025
Desktop
Przesłany obraz „Tsunami Volume Surge - RVOL”Przesłany obraz „Tsunami Volume Surge - RVOL”

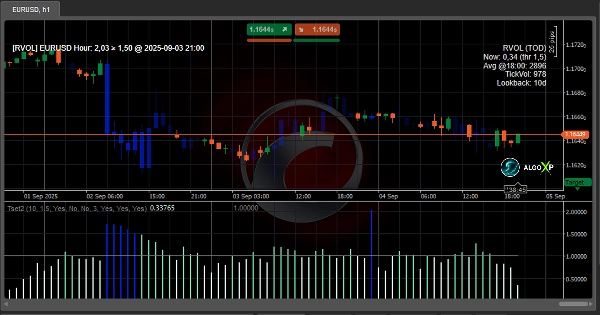
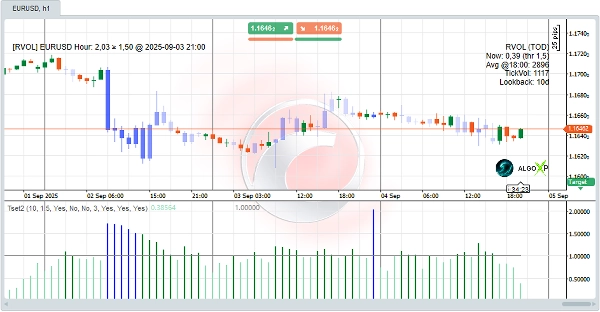
🌊 Tsunami Volume Surge (RVOL + Time-of-Day) is a precision volume tool for cTrader that shows you when the market is truly active.

Instead of looking at raw volume, Tsunami compares each bar’s activity to the average at the same time of day over your chosen Lookback Days. This time-of-day normalization exposes genuine participation spikes you can trade: treat 1.0 as “normal,” use 1.5–2.0 to confirm breakouts, and watch 3.0+ for explosive news moves. A clean RVOL histogram, dynamic candle coloring, and alerts & pop-ups make energy obvious at a glance - lightweight and fast on M1–M15 across FX, crypto, and indices. RVOL values can also feed your cBots as a simple, robust filter.

Explore more resources and a detailed FAQ on  AlgoXP

How to trade with it (quick start)

  1. Add Tsunami on your chart (M1–M15 works great). Set Lookback Days (start with 20–30).
  2. Keep Baseline 1.0 visible. RVOL < 1.0 = quiet; ≥ 1.5–2.0 = confirm breakouts; ≥ 3.0 = news surge.
  3. Turn on Enable Alerts and choose Alert On Close Only (safer) or intrabar (faster).
  4. Use Colorize Bars for instant read of energy; adjust Bar Color to taste.
  5. (Optional) In cBots, read the RVOL series to filter signals to active windows only.

🚀 Result: Tsunami turns volume into a time-aware edge - helping you skip dead periods, confirm real breakouts, and react faster when the market wakes up.


0.0
Opinie: 0
Opinie klientów
Ten produkt nie ma jeszcze opinii. Wypróbowałeś(-aś) go już? Bądź pierwszy(-a) i powiedz o tym innym!
Więcej od tego autora
cBot
Grid
XAUUSD
Prop
+3
Maya Gold Grid ATR - TEST VERSION
🌞 Smart Gold Grid. ATR Precision. + 1 800 000% ROI in 6 years backtest 🌞
cBot
Grid
Prop
XAUUSD
+3
Maya Gold Grid ATR
🌞 Smart Gold Grid. ATR Precision. +35% in 30 Days🌞
Wskaźnik
NAS100
NZDUSD
XAUUSD
+11
Support and Resistance Lite
🟢 Real swing-based support & resistance with ATR-powered half-bands 🔴
Wskaźnik
NAS100
NZDUSD
Breakout
+12
Samurai Breakout Pro II
⚔️Full breakout trading workstation: session box, EP/TP/SL levels, on-chart ✓/✗ outcomes, pro-level analytics and more⚔️
Wskaźnik
NAS100
NZDUSD
XAUUSD
+12
Coral Filter Lite
🐠 Free trend baseline - without the noise. Free limited version of Coral Filter X Pro 🐠
Wskaźnik
NAS100
NZDUSD
XAUUSD
+12
Coral Filter X Pro
🐠 Coral Filter X Pro turns trend detection into a simple, repeatable workflow 🐠
Wskaźnik
NAS100
NZDUSD
XAUUSD
+11
Samurai Breakout Lite
⚔️Limited version. Draws clean session box (Tokyo / London / New York / Overlap) and optional breakout plan (EP/TP/SL)⚔️
cBot
Breakout
Prop
Forex
+1
Lisa EURUSD Breakout
✨ Lisa EURUSD Breakout - Session Box Precision for EURUSD. Up to +176% in 30 Days✨
cBot
Breakout
Prop
Forex
+1
Lisa EURUSD Breakout - TEST VERSION
✨ Lisa EURUSD Breakout - Session Box Precision for EURUSD. Up to +176% in 30 Days✨
Wskaźnik
NAS100
NZDUSD
XAUUSD
+11
ADXVMA Aurora Trend Filter
⚡ ADXVMA Aurora Trend Filter combines ADX trend strength with an adaptive EMA blend ⚡
Wskaźnik
NAS100
XAUUSD
Prop
+5
Support and Resistance MTF Pro
🟢 Strength-ranked S/R zones with MTF levels and Pro labels. Nearest-zone band and HUD for faster, cleaner entries. 🔴
Wskaźnik
NAS100
NZDUSD
XAUUSD
+10
Atlas Seasonal Returns Heatmap
🧭 See when your market tends to move—by Month, Day-of-Week, or Hour-of-Day🧭
Wskaźnik
NAS100
NZDUSD
Breakout
+13
Meridian Pivot Points Pro
🚀See the market’s framework, decide faster. Session-Aware Pivots. Auto Presets. Pro-Grade Zones.🚀
Wskaźnik
NAS100
NZDUSD
XAUUSD
+10
Nebula Range Filter Pro
⚡Nebula Range Filter is a professional trend filter indicator for cTrader⚡
Możesz także polubić
Wskaźnik
Signal
dark-cloud
The Dark Cloud Cover indicator detects a bearish reversal pattern, marking key candles and confirming signals based on v
Wskaźnik
Indices
Prop
Commodities
+4
Pivot Point Smart Money Concept
Transform your approach to trading with our innovative Pivot Point Indicator.
E7 Polynomial Regression Channel
Polynomial Regression Channel which also reflects the volatility of the underlying asset.
Wskaźnik
Indices
RSI
Signal
+2
[Stellar Strategies] Ultimate Trend & Momentum Dashboard
A comprehensive cTrader indicator designed to give you a quick, at-a-glance understanding of market sentiment 📈📉
Wskaźnik
NAS100
NZDUSD
XAUUSD
+16
Swing AVWAP Pro
Adaptive Swing-Anchored VWAP that tracks market structure shifts with precision and clarity.
Wskaźnik
NAS100
NZDUSD
Breakout
+18
Volume Profile Pivot Box Range
Most advanced Volume Profile Pivot Box indicator — auto pivots, volume zones, smart candle coloring & SMC trading tool.
Tradingview Economic Calendar onn Chart
Customizable window inside your platform, access to any website Calendar
Wskaźnik
ATR
Signal
Chandelier Flip Stop
An intelligent chandelier-style trailing stop that flips when price breaks the opposite stop.
Wskaźnik
NAS100
NZDUSD
XAUUSD
+12
QQE Qualitative Quantity Estimation
Unlock trading precision with QQE! Dual QQE indicators with a Bollinger Bands zero line provide clear buy/sell signals.
Wskaźnik
VWAP
RSI
Breakout
+7
Anchored VWAP by LudwigICT
📈 Anchored VWAP with auto High/Low, session resets, Daily VWAP & TWAP — precise, Pine-accurate port.
MAMA CANDLES
This code implements the MESA Adaptive Moving Average (MAMA) indicator, it creates candles based on MAMA calculations.
Wskaźnik
Grid
NAS100
NZDUSD
+17
Institutional Volume Supply Demand
Volume Profile Supply Demand
LT_FairValueGap
Detects valid Fair Value Gaps from strong 3-bar patterns. Keep drawing unfilled gaps until price fills them.
Session Highlight Framer
Frame the sessions
Market Sessions - Free
Track major trading sessions (Tokyo, London, New York) with customizable colors and visual sessions on your chart.
Wskaźnik
Indices
Breakout
Stocks
+2
VegaXLR - cTrader Pitchfork & Channel Enhancer
Enhance Pitchfork & Price Channels in cTrader with customizable Equidistant and Fibonacci levels.
Candles_Painter
Overlay HTF context on any chart: color bars by HTF and draw filled HTF bodies with optional High/Low lines.
Anchored VWAP Buttons