
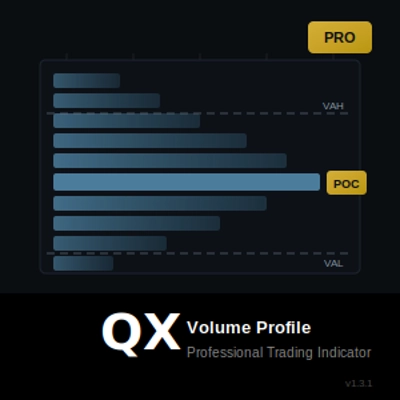
QX VolumeProfile Pro
Indicator
1 purchases
Version 1.0, Jan 2026
Windows, Mac
4.3
Reviews: 3
41.97M
Traded volume
208.53K
Pips won
14
Sales
694
Free installs
Description
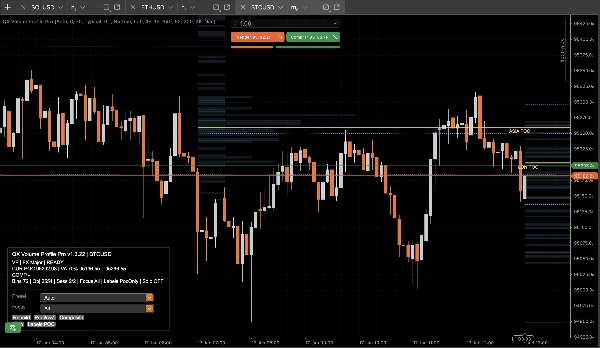
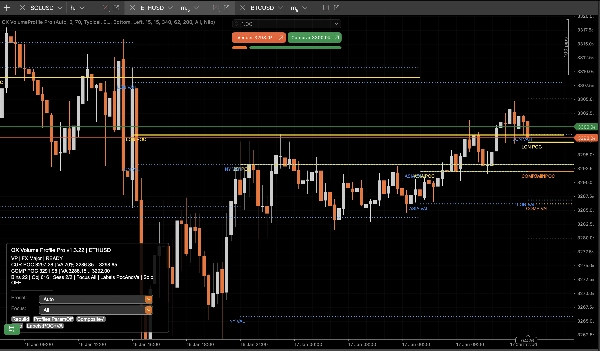
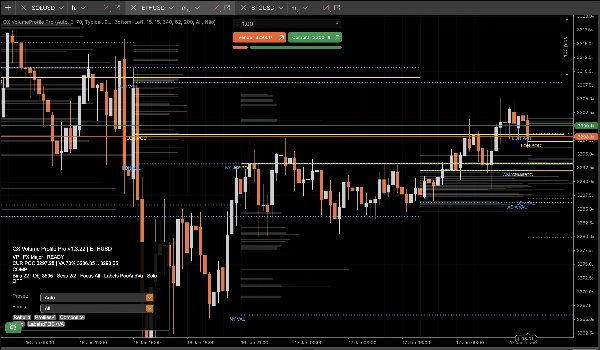
QX Volume Profile Pro is a production-grade Session Volume Profile built for real trading conditions: fast, stable, deterministic, and clean on the hard right edge.
Stop using bloated “profile” tools that lag, clutter your chart, break autoscale, and leave ghost objects behind.
Why QX VP Pro is different?
What most tools get wrong, we engineered out:
- No ghost objects. Toggle Profiles/Labels ON/OFF without leftover junk.
- No chart distortion. True overlay behavior that does not wreck price autoscale.
- Live-ready performance. Runs bar-close for stability and speed, not tick-chaos.
- Object hygiene + caps. Prevents runaway chart object spam that kills performance.
- Deterministic rebuild. Reload, rebuild, and focus changes stay consistent and predictable.
What you get on the chart
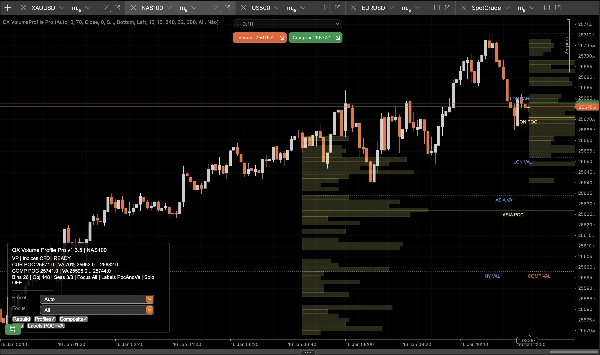
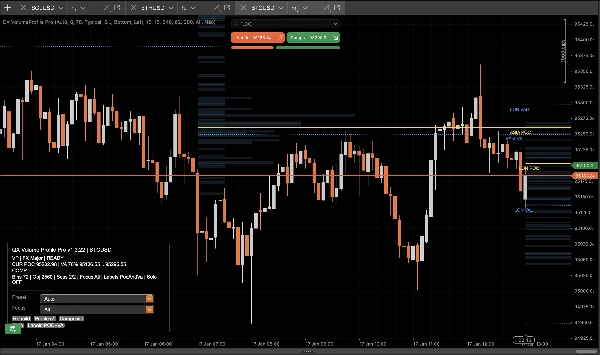
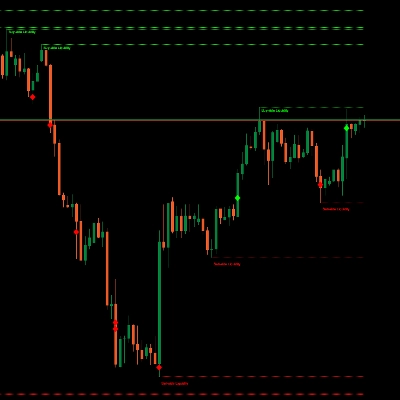
- Session Profiles (ASIA / LON / NY / C1 / C2) with clean POC / VAH / VAL levels.
- Composite Profile (multi-session merged) for dominant value zones and “real” market acceptance.
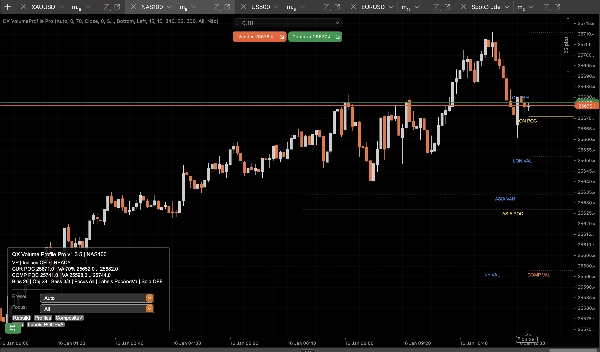
- Key Levels (Yesterday + Weekly) for context and confluence without clutter.
- Smart Labels that identify session and reduce overlap for fast right-edge reading.
- Focus Session filter to isolate only what matters right now.
- Composite Solo mode for a surgical view: composite + key levels only.
How to Use (Practical Trading Workflow)
1) Pick your operating mode
- Session Mode: Use session POC/VAH/VAL as intraday acceptance and rejection levels.
- Composite Mode: Use composite POC/VAH/VAL as higher-confidence “value” anchors across sessions.
2) Setup for your style
- Scalpers:
- Use XAU Scalper or FX Major preset
- Turn Labels = POC only for max clarity
- Use Focus = Current during execution
- Intraday / Swing:
- Use XAU Swing or Indices CFD preset
- Enable Composite
- Keep Yesterday/Weekly ON for structure alignment
3) Interpret the levels (simple rules)
- POC (Point of Control): The price most accepted by volume.
- Above POC: bullish acceptance bias
- Below POC: bearish acceptance bias
- VAH / VAL (Value Area High/Low): “Fair value boundary.”
- Break + hold outside VA: continuation / trend expansion
- Rejection back inside VA: mean reversion / fade setups
- Composite VA: Stronger “macro intraday” value zone. Use it as a magnet or boundary.
4) Execution checklist (fast)
- Identify your key zone: Session VA or Composite VA
- Look for price reaction: rejection or acceptance
- Use Key Levels (Yesterday/Weekly) as confluence
- Use Focus to remove noise and stay objective
- Use Composite Solo when you want only the highest-signal view
Controls (What the panel does)
- Profiles: Show/hide histograms instantly (levels remain clean and consistent).
- Composite: Toggle merged profile levels.
- Focus: All / Current / ASIA / LON / NY / C1 / C2.
- Solo: Composite + Key Levels only.
Notes
- Indicator only. No trades are placed.
- Designed for stability and performance in live charts.
Summary
AI summary
QX VolumeProfile Pro is a session-based volume profile indicator designed for real trading conditions, offering fast, stable, and deterministic performance without chart clutter or lag. It provides clean volume profiles for multiple trading sessions (ASIA, LON, NY, C1, C2) with key levels including Point of Control (POC), Value Area High (VAH), and Value Area Low (VAL). The tool supports both session and composite modes, allowing traders to analyze intraday acceptance/rejection levels or multi-session value zones.
Key features include:
- No ghost objects or chart distortion, preserving autoscale integrity.
- Live-ready bar-close updates for stability and speed.
- Object management to prevent performance degradation.
- Smart labels that reduce overlap for clear right-edge reading.
- Focus session filtering to isolate relevant data.
- Composite Solo mode for a simplified view with composite profiles and key levels.
The indicator supports practical workflows for scalpers and intraday/swing traders with presets tailored for instruments like gold (XAU), forex majors, indices, and CFDs. Users can toggle profile visibility, composite levels, focus sessions, and solo mode via an integrated control panel.
QX VolumeProfile Pro is an indicator-only tool, designed to enhance chart analysis by highlighting volume-based market acceptance and rejection zones without executing trades.
Indicator profile
Customer reviews
4.3
Reviews: 3
5 | 33 % | |
4 | 67 % | |
3 | 0 % | |
2 | 0 % | |
1 | 0 % |
Customer reviews
January 27, 2026
Not perfect, but the workflow felt cleaner. It should not replace the chart.
January 20, 2026
Discussion
FAQ
Signal
Indices
Commodities
GBPUSD
RSI
Bollinger
Fibonacci
Scalping
AI
XAUUSD
NAS100
MACD
BTCUSD
Forex
Breakout
EURUSD
NZDUSD
Prop
ZigZag
Supertrend
Fair Value Gap
SMC
Crypto
Grid
Stocks
ATR
USDJPY
VWAP
Products available through cTrader Store, including trading bots, indicators and plugins, are provided by third-party developers and made available for informational and technical access purposes only. cTrader Store is not a broker and does not provide investment advice, personal recommendations or any guarantee of future performance.






Price
41.97M
Traded volume
208.53K
Pips won
14
Sales
694
Free installs