
Opis
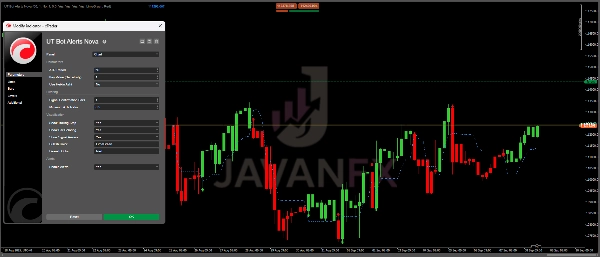
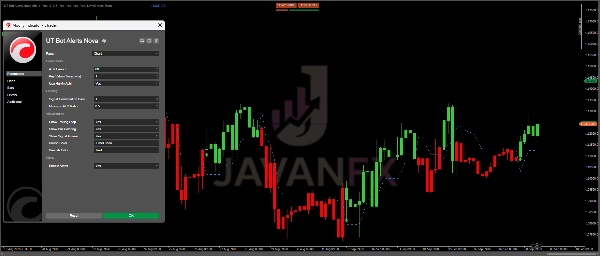
The UT Bot Alerts Nova to zaawansowany wskaźnik podążający za trendem, zaprojektowany dla traderów poszukujących precyzyjnych sygnałów wejścia i wyjścia na dynamicznych rynkach. Opierając się na obliczeniach Average True Range (ATR), generuje dynamiczne trailing stopy, które dostosowują się do zmienności rynku, pomagając uchwycić trendy przy jednoczesnym minimalizowaniu fałszywych sygnałów. W przeciwieństwie do oscylatorów czy narzędzi opartych na wolumenie, ten wskaźnik doskonale identyfikuje utrzymujące się ruchy cen, kolorując świece na zielono podczas trendów wzrostowych i na czerwono podczas spadkowych, z wyraźnymi strzałkami kupna/sprzedaży dla sygnałów do działania.
Kluczowe cechy i personalizacja
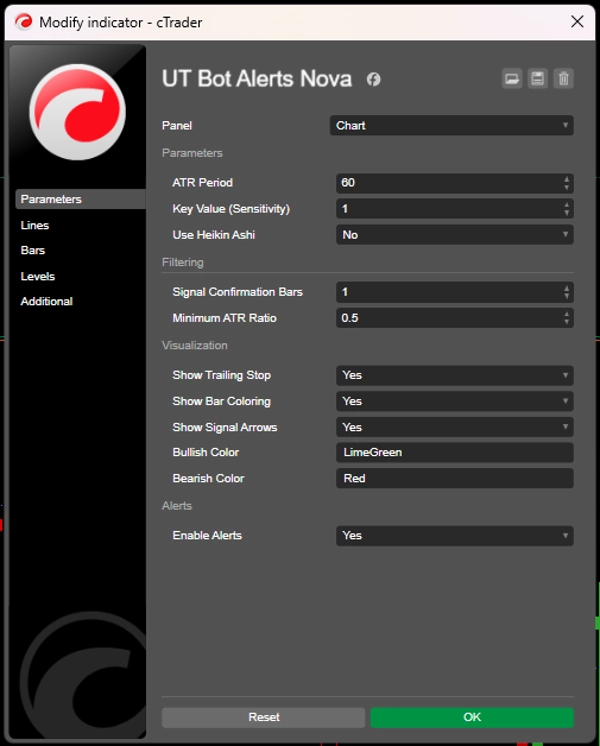
- Trailing stopy oparte na ATR: Automatycznie dostosowują czułość do zmienności, zapewniając wiarygodną podstawę do potwierdzenia trendu.
- Dostosowywalne parametry: Modyfikuj wartość kluczową (mnożnik ATR, domyślnie 1-3,5 dla czułości) oraz okres ATR (domyślnie 10-20 świec), aby dopasować do swojego stylu.
- Opcja Heikin Ashi: Wygładza ruch cen, redukując szumy i zwiększając dokładność sygnałów na niestabilnych wykresach.
- Wizualne alerty: Powiadomienia w czasie rzeczywistym o przecięciach, dzięki czemu nigdy nie przegapisz okazji handlowej.
Preferowane okresy i instrumenty
Ten wskaźnik najlepiej sprawdza się na wyższych interwałach czasowych, aby odfiltrować szumy i dopasować się do głównych trendów:
- Zalecane interwały czasowe: wykresy 4-godzinne (4H), dzienne (1D) lub tygodniowe dla optymalnych rezultatów. Można je dostosować do 30-minutowych lub 1-godzinnych wykresów do handlu intraday, ale zaleca się testy wsteczne, aby uniknąć fałszywych sygnałów na rynkach bocznych.
- Idealne instrumenty: Uniwersalny dla różnych klas aktywów, w tym:
-
- Kryptowaluty takie jak BTCUSD czy ETHUSD, gdzie zmienność jest wysoka, a trendy wyraźne.
- Pary walutowe Forex takie jak EURUSD, GBPUSD czy USDJPY dla stabilnego podążania za trendem.
- Akcje i indeksy (np. AAPL, SPX) w warunkach trendujących, choć najlepiej sprawdza się na płynnych, zmiennych rynkach.
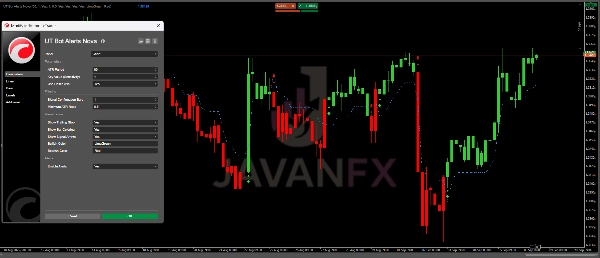
Na przykład na wykresie 4H BTCUSD z domyślnymi ustawieniami skutecznie sygnalizuje wejścia długie, gdy cena przebija trailing stop podczas trendów wzrostowych.
Przypadki użycia w handlu
- Kontynuacja trendu: Wejścia długie na sygnały zielonej strzałki, gdy cena jest powyżej trailing stop, idealne do jazdy na byczych trendach w rajdach kryptowalut. Wyjścia na czerwonych strzałkach lub naruszeniach trailing stop dla zabezpieczenia zysków.
- Wykrywanie odwróceń: Używaj przecięć (np. EMA nad ATR) do wykrywania potencjalnych zmian trendu, łącząc z poziomami wsparcia/oporu dla wysokoprawdopodobnych odwróceń na rynku Forex.
- Trading wybicia: W niestabilnych sesjach alerty potwierdzają wybicia z konsolidacji, pomagając skalperom lub traderom swingowym na wykresach 1H celować w stosunki ryzyka do zysku 1:3.
- Integracja zarządzania ryzykiem: Łącz z 200-okresową EMA jako filtrem trendu — bierz tylko pozycje długie powyżej EMA. Ustaw stop loss na linii trailing i cele na podstawie wielokrotności ATR dla spójnej wydajności.
Ważne zastrzeżenie
Wyniki historyczne nie gwarantują przyszłych rezultatów. Ten wskaźnik służy wyłącznie celom edukacyjnym i nie stanowi porady finansowej. Zawsze przeprowadzaj własne testy wsteczne i stosuj odpowiednie zarządzanie ryzykiem, ponieważ handel wiąże się ze znacznym ryzykiem strat. Wyniki mogą się różnić w zależności od warunków rynkowych
Podsumowanie
Designed for higher timeframes such as 4-hour, daily, and weekly charts, it is suitable for various markets including cryptocurrencies (e.g., BTCUSD, ETHUSD), forex pairs (e.g., EURUSD, GBPUSD), stocks, and indices. Use cases include trend continuation, reversal detection, breakout trading, and risk management integration by combining with moving averages like the 200-period EMA.
The indicator supports real-time visual alerts for crossover events, helping traders identify trade opportunities promptly. It is optimized for liquid and volatile markets and can be adapted for intraday trading on shorter timeframes with appropriate backtesting.
Opinie klientów
5 | 100 % | |
4 | 0 % | |
3 | 0 % | |
2 | 0 % | |
1 | 0 % |


