
Opis
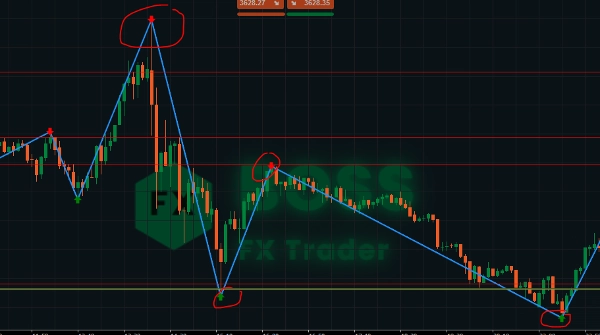
Wskaźnik ZigZag to narzędzie struktury rynku, które filtruje małe wahania cen i wyróżnia główne szczyty i dołki. Łącząc te punkty liniami, traderzy mogą łatwo identyfikować trendy, odwrócenia i formacje wykresów.
Samodzielnie nie generuje sygnałów kupna/sprzedaży, ale w połączeniu z analizą cen, wsparciem/oporem lub innymi wskaźnikami staje się potężnym narzędziem do skalpowania, handlu intraday i strategii swing.
🔎 Kluczowe cechy
- Upraszcza szumy rynkowe, pokazując wyraźne wahania cen.
- Pomaga zidentyfikować poziomy wsparcia i oporu.
- Przydatny do rozpoznawania formacji wykresów (głowa i ramiona, podwójne szczyty/dołki, trójkąty).
- Pomaga w potwierdzaniu trendu oraz wejściach po cofnięciach.
- Wskaźnik strzałek Sprzedaży i Kupna
⚡ Skalpowanie z ZigZag
- Interwały czasowe: 1m – 5m
- Cel: Łapanie małych, ale częstych ruchów.
- Jak używać:
-
- Czekaj na utworzenie nowego szczytu/dołka.
- Oznacz je jako mikro wsparcie lub opór.
- Wchodź w transakcje na wyłamaniach lub cofnięciach do tych poziomów ZigZag.
- Ustaw stop-loss tuż poza ostatnim wahaniem (ciasne ryzyko).
- Celuj w szybki TP (5–15 pipsów w zależności od zmienności).
👉 Najlepiej działa podczas sesji o wysokiej zmienności (otwarcie Londynu / Nowego Jorku).
⏱️ Handel intraday z ZigZag
- Interwały czasowe: 15m – 1H
- Cel: Handel dziennymi trendami i kluczowymi odwróceniami intraday.
- Jak używać:
-
- Zidentyfikuj główny trend intraday używając wyższych wahań ZigZag.
- Użyj punktów ZigZag jako stref obrotu do wejścia (kupuj spadki w trendzie wzrostowym, sprzedawaj wzrosty w trendzie spadkowym).
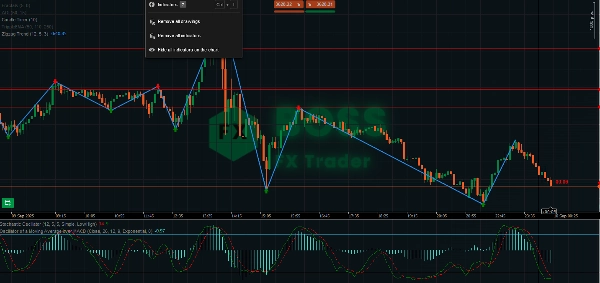
- Połącz z oscylatorami (RSI/Stochastic) dla potwierdzenia wykupienia/wyprzedania blisko ekstremów ZigZag.
- Użyj poprzedniego szczytu/dołka jako logicznych poziomów SL/TP.
👉 Świetne dla day traderów, którzy chcą ruchów 20–50 pipsów.
📆 Handel swingowy z ZigZag
- Interwały czasowe: 4H – Dzienny
- Cel: Łapanie dużych ruchów trendu i pozycjonowanie transakcji.
- Jak używać:
-
- Użyj ZigZag do identyfikacji głównej struktury rynku (wyższe szczyty i wyższe dołki = trend wzrostowy).
- Wchodź po cofnięciach, gdy tworzy się nowy dołek w trendzie wzrostowym.
- Ustaw SL poniżej ostatniego dużego dołka.
- Celuj w 2–3-krotność ryzyka lub następny poziom wahań ZigZag.
- Użyj ZigZag do wykrywania formacji odwrócenia (podwójny szczyt/dołek, głowa i ramiona) jako sygnałów wyjścia.
👉 Idealne do utrzymywania pozycji przez dni do tygodni.
📌 Profesjonalne wskazówki
- Dostosuj głębokość: Mniejsza = bardziej czuły (dobry do skalpowania). Większa = filtruje szumy (lepszy do swingów).
- Łącz z wolumenem, filtrami trendu lub średnimi kroczącymi dla potwierdzenia.
- Zawsze sprawdzaj ZigZag na wyższych interwałach przed wejściem — małe wahania w większym trendzie mogą być pułapkami.
- Używaj ZigZag do weryfikacji formacji wykresów (trójkąty, kliny).
Życzymy zyskownych transakcji!
Podsumowanie
Key features include simplification of market noise, identification of support and resistance levels, trend confirmation, and assistance with pullback entries. It supports multiple trading styles across various timeframes: scalping (1–5 minutes), intraday trading (15 minutes to 1 hour), and swing trading (4 hours to daily). Users can adjust the indicator’s sensitivity to suit different trading approaches and combine it with volume or moving averages for confirmation. The tool is applicable to diverse markets including Forex, indices, commodities, stocks, and cryptocurrencies, supporting symbols like EURUSD, GBPUSD, XAUUSD, NAS100, and BTCUSD.
Opinie klientów
5 | 67 % | |
4 | 33 % | |
3 | 0 % | |
2 | 0 % | |
1 | 0 % |


![Logo „Gaussian Channel [Iridio Capital]”](https://cdn.ctrader.com/image/webp/7c039209-5573-4a54-a072-f9528b503103_41960)


