
Opis
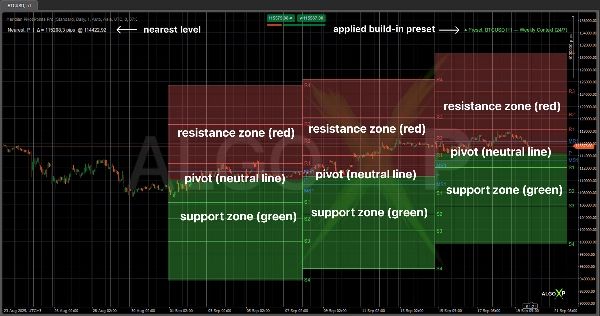
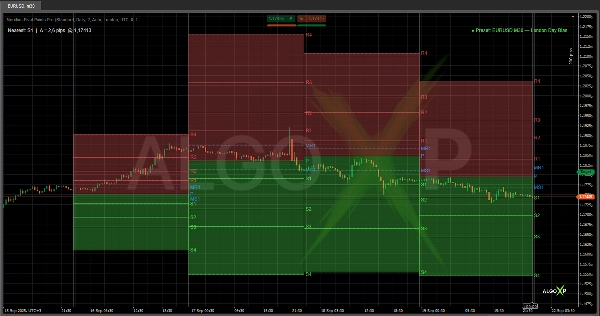
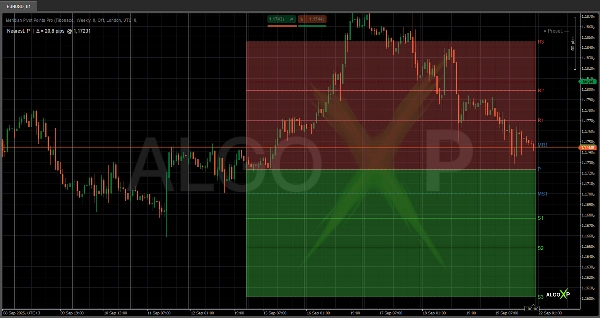
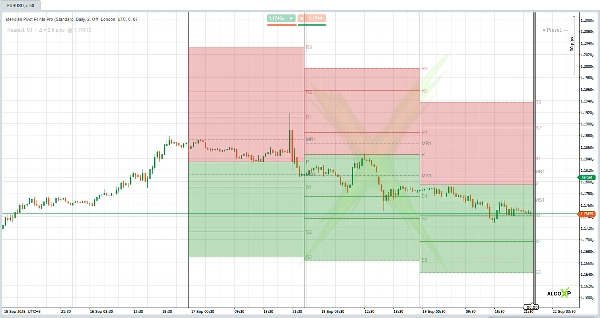
🚀 Meridian Pivot Points Pro to premiumowy wskaźnik pivot dla cTrader, który dostosowuje się do sesji i interwałów czasowych. Rysuje profesjonalne poziomy pivot (P, R1–R5, S1–S5) dla formuł Standard, Fibonacci, Woodie, Camarilla i DeMark, dodaje poziomy pośrednie oraz podświetla strefy (zielone poniżej P, czerwone powyżej P) z regulowaną przezroczystością.
Wbudowane Auto Presets natychmiast dostosowują ustawienia dla popularnych symboli i interwałów czasowych. HUD pokazuje najbliższy poziom (z odległością w pipsach) oraz nazwę aktywnego presetu po dopasowaniu. Inteligentne alerty informują o przecięciu lub bliskości poziomu — z niezależną kontrolą dźwięku.
Działa od razu dla Forex, indeksów, złota, ropy i kryptowalut na rynkach intraday i swing tradingu.
Odkryj więcej zasobów i szczegółowe FAQ na AlgoXP
🔥 Dlaczego traderzy wybierają Meridian
- Świadomość sesji: używaj dziennych/tygodniowych/miesięcznych pivotów lub trybu Sesji z gotowymi presetami (Tokyo, London, New York, Overlap itd.) oraz przesunięciem UTC/Broker/Własnym.
- Auto Presets (nowość): po włączeniu wskaźnik automatycznie stosuje wyselekcjonowaną konfigurację dla znanych kombinacji symbol + interwał i pokazuje nazwę presetu w HUD.
- Przejrzystość w designie: poziomy pośrednie, etykiety, czyste motywy i półprzezroczyste pasy (wspiera zielony, czerwony dla oporów, niebieski dla pivotów).
- Praktyczne alerty: przecięcie przy zamknięciu świecy i bliskość w pipsach, każdy z własnym przełącznikiem dźwięku.
- Lekki i czytelny: zoptymalizowany do rysowania bieżących i (opcjonalnie) historycznych okresów z wyraźną typografią.
🧭 Jak używać
- Nastawienie: Powyżej P = nastawienie bycze; poniżej P = nastawienie niedźwiedzie.
- Pracuj ze strefami: W zielonej strefie, szukaj okazji do kupna w kierunku P → R1; w czerwonej, szukaj okazji do sprzedaży w kierunku P → S1.
- Poziomy pośrednie: MR1/MS1 to czyste punkty cofnięcia/testu wewnątrz P–R1 i S1–P.
- Przebicie i zamknięcie: Zamknięcie powyżej R1 → cel R2 (następnie R3…); zamknięcie poniżej S1 → cel S2 (następnie S3…).
- Tryb sesji: Handluj w swoim aktywnym oknie (np. London lub nakładka London–NY) dla czystszych dotknięć i kontynuacji.
🤖 Wbudowane presety
EURUSD M30, GBPUSD M15, USDJPY M5, XAUUSD M15, XAUUSD H1, US100 M5, USOIL M15, DAX40 M5, BTCUSD H1, ETHUSD H1, EURUSD H1, GBPJPY M15.
Podsumowanie
Key features include session modes with presets for major trading sessions (Tokyo, London, New York, and overlaps), automatic presets that optimize settings for popular symbols and timeframes, and a heads-up display (HUD) showing the nearest pivot level and active preset. Smart alerts notify users on pivot level crosses or proximity, each with independent sound controls.
Meridian Pivot Points Pro supports multiple markets such as Forex, indices, gold, oil, and cryptocurrencies, suitable for intraday and swing trading. It emphasizes clarity with clean labels, semi-transparent bands, and optimized drawing for current and historical periods. Built-in presets cover common symbol and timeframe combinations like EURUSD M30, GBPUSD M15, XAUUSD H1, BTCUSD H1, and others, facilitating quick setup and use.
Opinie klientów
5 | 100 % | |
4 | 0 % | |
3 | 0 % | |
2 | 0 % | |
1 | 0 % |


