
Opis
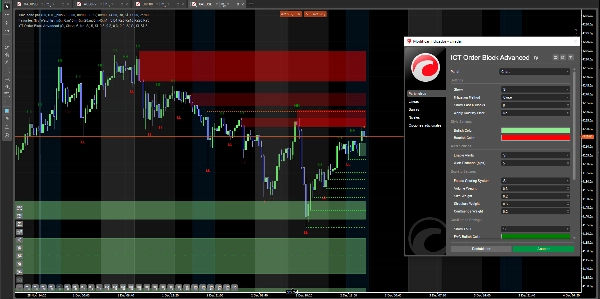
🚀 ICT Order Block Advanced - Profesjonalny wskaźnik handlowy
Opanuj koncepcje ICT dzięki najbardziej kompletnemu systemowi Order Block
ICT Order Block Advanced to ostateczne narzędzie dla traderów stosujących metodologię ICT (Inner Circle Trader). To nie jest zwykły wskaźnik order block - to kompletny instytucjonalny system handlowy, który identyfikuje Order Blocki, Fair Value Gaps, Strefy Płynności, Breaker Blocki oraz Strukturę Rynku w jednym potężnym pakiecie.
💎 Dlaczego to jest najbardziej zaawansowany wskaźnik Order Block
Ten wskaźnik łączy PIĘĆ kluczowych koncepcji ICT w jeden spójny system:
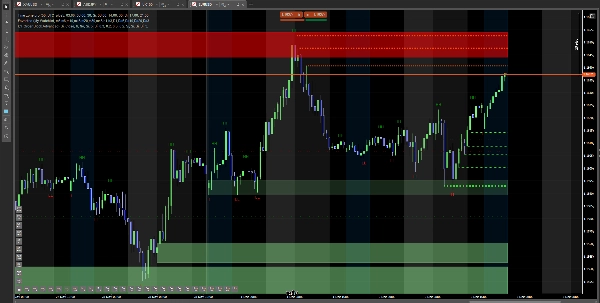
✅ Order Blocki (OB) - miejsca, gdzie instytucje składały swoje zlecenia
✅ Fair Value Gaps (FVG) - nierównowagi, które instytucje muszą wypełnić
✅ Strefy Płynności - miejsca, gdzie gromadzą się stop lossy (cele skanowania)
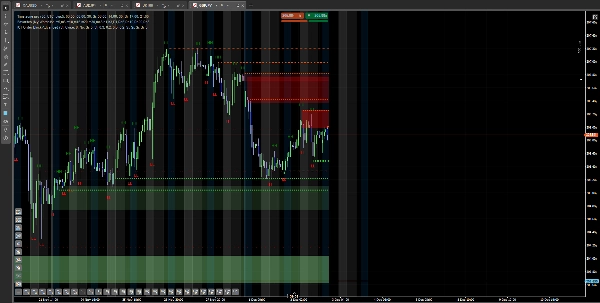
✅ Breaker Blocki - nieudane OB, które stają się strefami odwrócenia
✅ Struktura Rynku - identyfikacja HH, HL, LH, LL z BOS/CHoCH
To jest metodologia ICT w najczystszej, najbardziej praktycznej formie.
✨ Kluczowe cechy, które wyróżniają ten wskaźnik
🎯 Inteligentne wykrywanie Order Blocków
- Automatycznie identyfikuje instytucjonalne order blocki
- Pokazuje ostatnie 6 najnowszych bloków (konfigurowalne 1-15)
- Kolorowane według kierunku (Zielony = Byczy, Czerwony = Niedźwiedzi)
- Automatyczne usuwanie po zniwelowaniu
📊 System oceny jakości (A+ do C)
- Ocena każdego Order Blocka pod względem jakości (A+, A, B, C)
- Uwzględnia wolumen, rozmiar, strukturę i konfluencję
- Wyższa ocena = większe prawdopodobieństwo udanego trade'u
- Przezroczystość wizualna pokazuje jakość natychmiast
🎨 Wykrywanie Fair Value Gaps (FVG)
- Identyfikuje bycze i niedźwiedzie nierównowagi
- Kolory konfigurowalne (zielone/czerwone strefy)
- Automatyczne usuwanie po wypełnieniu
- Pokazuje, gdzie cena prawdopodobnie wróci
💰 Mapowanie stref płynności
- Oznacza ostatnie maksima/minima (zbiorniki płynności)
- Pokazuje, gdzie instytucje będą skanować stop lossy
- Grubość linii = siła płynności
- Idealne do trade'ów typu liquidity grab
🔄 Identyfikacja Breaker Blocków
- Wykrywa, kiedy Order Blocki zawodzą i zmieniają się
- Dawne wsparcie staje się oporem (i odwrotnie)
- Pokazuje instytucjonalne pułapki
- Tajna broń zaawansowanych traderów
📈 Kompletna struktura rynku
- Oznacza HH (Higher High), HL (Higher Low)
- Oznacza LH (Lower High), LL (Lower Low)
- Automatycznie rysuje linie trendu
- Identyfikuje BOS (Break of Structure) i CHoCH (Change of Character)
⚡ Filtr zmienności
- Opcjonalny filtr oparty na ATR
- Pokazuje OB tylko podczas wysokiej zmienności
- Filtruje słabe/bloki niskiej jakości
- Skupia się tylko na instytucjonalnych setupach
🎯 Jak profesjonalni traderzy ICT korzystają z tego
Strategia 1: Wejście w wysokiej jakości Order Block
Setup: Rynek tworzy Order Block, wskaźnik ocenia go na "A+" lub "A"
Trade:
- Czekaj, aż cena wróci do strefy OB
- Wejdź, gdy cena dotknie OB (pokazane jako zielony/czerwony prostokąt)
- Stop loss: poza OB
- Cel: następna strefa płynności lub przeciwległy OB
Dlaczego to działa: Bloki ocenione na A+ mają największe zainteresowanie instytucjonalne - wolumen, struktura i konfluencja są zgodne. To są bloki, które instytucje będą bronić.
Strategia 2: Konfluencja Fair Value Gap + Order Block
Idealny setup:
- Order Block się formuje (zielony prostokąt)
- Fair Value Gap pojawia się na tym samym poziomie (jaśniejsza zielona strefa)
- Cena cofa się do tej strefy konfluencji
Wejście: Wejdź LONG, gdy obie strefy się pokrywają. Podwójne zainteresowanie instytucjonalne = podwójne prawdopodobieństwo.
Dlaczego to jest potężne: Instytucje zostawiły DWA rodzaje nierówności na tej samej cenie - WRÓCĄ tutaj.
Strategia 3: Skanowanie płynności do Order Block
Klasyk ICT:
- Zidentyfikuj strefę płynności (kropkowana linia przy ostatnim minimum)
- Cena skanuje poniżej niej (bierze stop lossy detaliczne)
- Cena natychmiast odwraca się do byczego Order Blocka
- WEJDŹ LONG - instytucje właśnie zebrały płynność i teraz kupują
Dlaczego to jest złoto: Tak działają instytucje: skanują płynność (stop lossy detaliczne), a następnie pchają cenę w przeciwnym kierunku. Łapiesz odwrócenie.
Strategia 4: Odwrócenie Breaker Block
Setup:
- Byczy Order Block zostaje zniwelowany (przerwany)
- Wskaźnik pokazuje go jako Breaker Block (ciemniejsza zielona linia kropkowana)
- Cena wraca, aby przetestować go od góry
Trade: SHORT, gdy cena dotknie Breaker Block od góry. To, co było wsparciem, jest teraz oporem.
Dlaczego to działa: Instytucje nie utrzymały tego poziomu - teraz bronią go z przeciwnej strony.
Strategia 5: Potwierdzenie struktury rynku
Używając HH, HL, LH, LL:
- Rynek pokazuje HL (Higher Low) + HH (Higher High) = bycza struktura
- Order Block formuje się przy HL
- Tylko bias LONG - struktura potwierdza kierunek
BOS vs CHoCH:
- BOS (Break of Structure) = kontynuacja trendu
- CHoCH (Change of Character) = odwrócenie trendu
- Handluj tylko OB zgodnie z aktualną strukturą
🔥 Co odróżnia to od podstawowych wskaźników Order Block
Podstawowe wskaźniki OB pokazują tylko order blocki, bez oceny jakości, bez Fair Value Gaps, bez stref płynności, bez breaker blocków, bez struktury rynku i traktują wszystkie OB jednakowo.
ICT Order Block Advanced pokazuje kompletny system ICT (5 koncepcji), ocenia jakość OB (A+ do C), automatycznie identyfikuje Fair Value Gaps, mapuje strefy płynności, wykrywa breaker blocki, oznacza kompletną strukturę rynku (HH/HL/LH/LL), posiada filtr zmienności i pokazuje strefy konfluencji.
To jest różnica między narzędziem a kompletnym systemem handlowym.
🎓 Kto potrzebuje tego wskaźnika?
✅ Studenci ICT - ucz się i stosuj koncepcje ICT poprawnie
✅ Traderzy Order Block - otrzymuj oceniane jakościowo OB z konfluencją
✅ Traderzy Smart Money - zobacz wszystkie ślady instytucjonalne
✅ Traderzy płynności - identyfikuj okazje do skanowania
✅ Traderzy struktury - automatyczne oznaczanie HH/HL/LH/LL
✅ Poważni traderzy - kompletny system, nie tylko jedna koncepcja
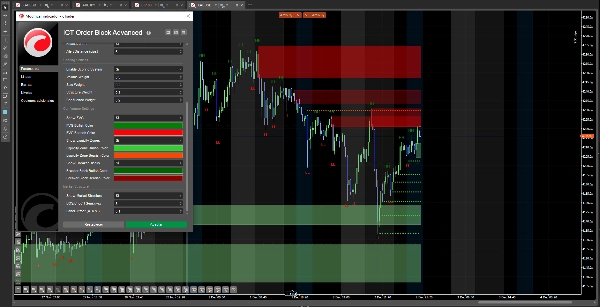
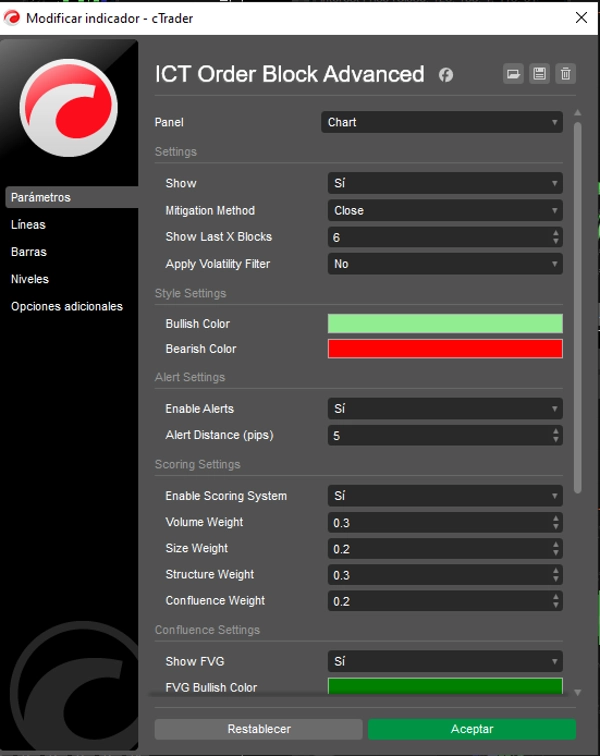
⚙️ W pełni konfigurowalny
Ustawienia Order Block:
- Pokaż ostatnie X bloków (1-15, domyślnie 6)
- Metoda niwelacji (Close lub Wick)
- Filtr zmienności włącz/wyłącz
- Kolory niestandardowe (Bycze/Niedźwiedzie)
System oceny jakości:
- Włącz/wyłącz ocenianie
- Dostosuj wagi: Wolumen, Rozmiar, Struktura, Konfluencja
- Niestandardowa przezroczystość według jakości
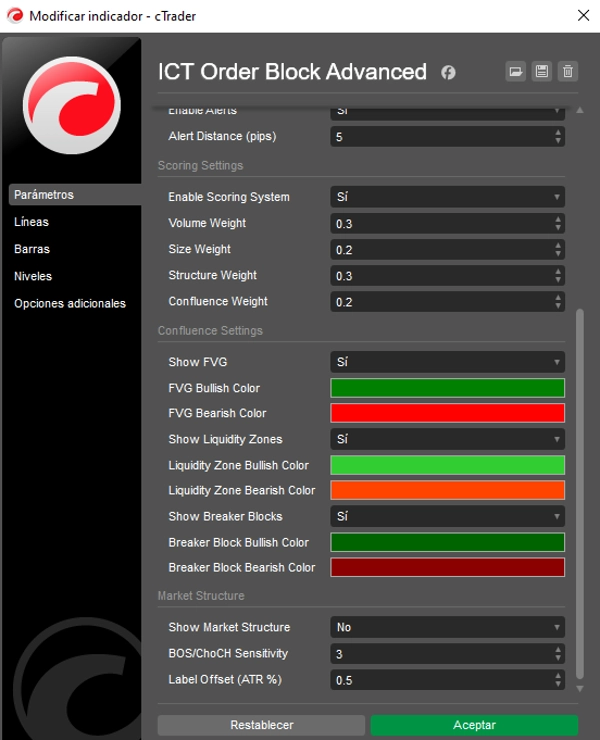
Funkcje konfluencji:
- Pokaż/ukryj Fair Value Gaps (kolory niestandardowe)
- Pokaż/ukryj strefy płynności (kolory niestandardowe)
- Pokaż/ukryj Breaker Blocki (kolory niestandardowe)
Struktura rynku:
- Pokaż/ukryj markery HH/HL/LH/LL
- Czułość BOS/CHoCH (1-10)
- Regulacja przesunięcia etykiety
- Automatyczne rysowanie linii trendu
🛡️ Wbudowane zarządzanie ryzykiem
Ustawienie Stop Loss:
- Tuż poza granicą Order Blocka
- Poniżej/powyżej Breaker Blocka
- Poza Fair Value Gap
Potwierdzenie wejścia:
- Czekaj na bloki ocenione na A lub A+
- Szukaj konfluencji (OB + FVG + Płynność)
- Potwierdź strukturą rynku (HH/HL dla longów)
Wielkość pozycji:
- Większa na blokach A+ z konfluencją
- Średnia na blokach ocenionych na A
- Mniejsza na blokach B/C lub pojedynczych setupach
Cele zysku:
- Następna strefa płynności
- Przeciwległy Order Block
- Fair Value Gap po drugiej stronie
- Poziomy struktury rynku (HH/LL)
🚀 Kompletny system ICT, którego potrzebujesz
Ten wskaźnik odpowiada na wszystkie pytania traderów ICT:
✅ Gdzie są Order Blocki? (zielone/czerwone prostokąty z ocenami)
✅ Które OB mają najwyższą jakość? (oceny A+, A, B, C)
✅ Gdzie są Fair Value Gaps? (jasnozielone/czerwone strefy)
✅ Gdzie jest płynność? (kropkowane linie przy maksimach/minimach)
✅ Czy są aktywne Breaker Blocki? (ciemniejsze linie kropkowane)
✅ Jaka jest struktura rynku? (markery HH, HL, LH, LL)
✅ Czy to BOS czy CHoCH? (linie trendu pokazują przełamania struktury)
Przestań składać wiele wskaźników. Zdobądź kompletny system ICT.
📈 Działa na wszystkich rynkach i ramach czasowych
- Forex - wszystkie pary (główny rynek ICT)
- Indeksy - NAS100, US30, UK100, SPX500, GER40
- Surowce - złoto, srebro, ropa
- Kryptowaluty - Bitcoin, Ethereum
- Ramki czasowe - od 1 minuty do dziennej (5min-1H optymalne dla ICT)
Uwaga: Koncepcje ICT działają najlepiej na płynnych rynkach z udziałem instytucji.
🎁 Opanuj handel ICT już dziś
Przestań walczyć z częściowymi systemami. Zdobądź kompletną metodologię ICT w jednym wskaźniku.
Zobacz Order Blocki. Oceń jakość. Znajdź konfluencję. Handluj strukturą. Śledź płynność.
Kompatybilny z cTrader. Jednorazowy zakup, dożywotnie aktualizacje.
Podsumowanie
Key features include automatic detection and color-coded display of recent order blocks with a quality grading system (A+ to C) based on volume, size, structure, and confluence. It identifies bullish and bearish Fair Value Gaps and liquidity pools, maps breaker blocks for reversal zones, and marks market structure with trend lines. An optional ATR-based volatility filter highlights high-probability setups.
The indicator supports multiple markets including Forex, indices, commodities, cryptocurrencies, and stocks, and works across timeframes from 1 minute to daily (optimal 5 minutes to 1 hour). It offers customizable settings for block display, scoring weights, colors, and structure sensitivity.
ICT Order Block Advanced also provides built-in risk management guidance with stop loss placement beyond order blocks or breaker blocks, entry confirmation through confluence and market structure, and position sizing recommendations based on block quality. This tool consolidates ICT concepts into a unified system for institutional-level market analysis.


![Logo „Smart Money Concepts (SMC) [Iridio Capital]”](https://cdn.ctrader.com/image/webp/28b69fd1-ef54-4bed-9487-07e78e883be4_40934)


