
Opis
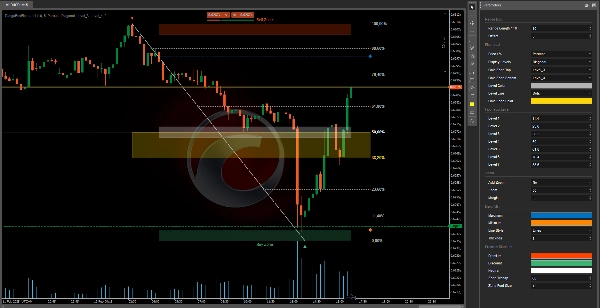
Ten wskaźnik zniesienia Fibonacciego pozwala traderom wizualizować i dostosowywać kluczowe poziomy zniesienia, aby zidentyfikować potencjalne strefy kupna i sprzedaży na rynku.
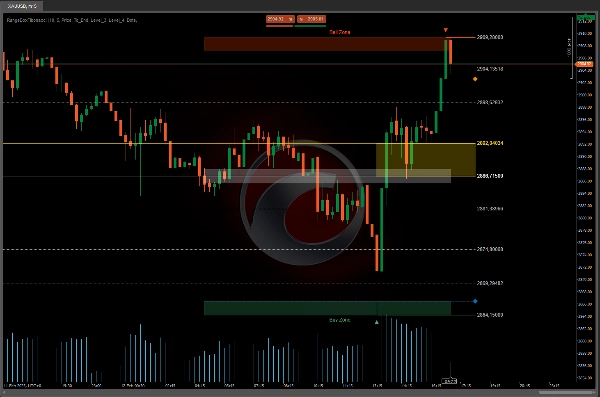
Oprócz kolorowych „Strefy Sprzedaży” i „Strefy Kupna”, użytkownicy mogą dostosować poziomy Fibonacciego według własnych upodobań.
Ten wskaźnik jest uzupełniony przez osobny wskaźnik alertów dla pełniejszego doświadczenia handlowego.
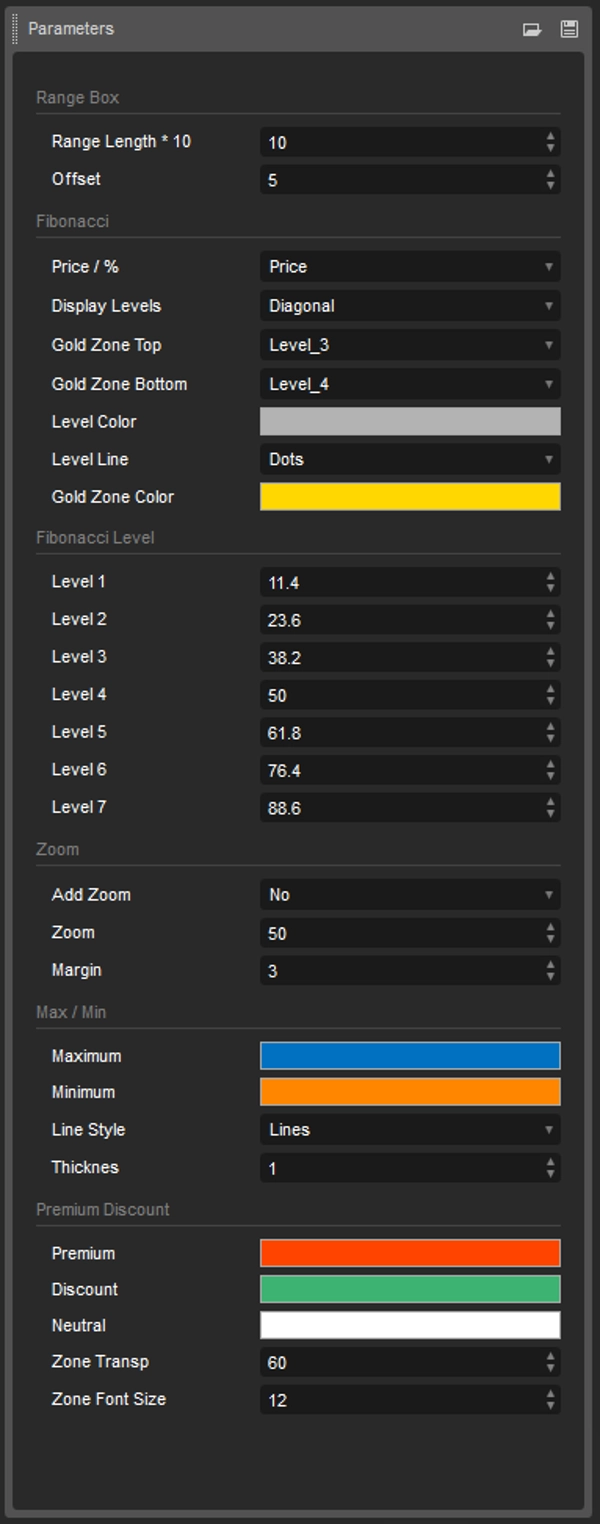
Dzięki temu wskaźnikowi zniesienia Fibonacciego traderzy mają pełną kontrolę nad poziomami zniesienia wyświetlanymi na wykresie.
Możliwość dostosowania poziomów Fibonacciego, wraz z kolorowymi strefami i osobnym wskaźnikiem alertów, pozwala użytkownikom dopasować narzędzie do ich indywidualnych strategii handlowych.
Jeśli dołączysz narzędzia takie jak:
- OrderPrice V3 https://ctrader.com/products/397
- NTMPICLL https://ctrader.com/products/327
- MACDVolume https://ctrader.com/products/267
- MarketSession-MX https://ctrader.com/products/525
Nie ma możliwości, aby stracić dużo pieniędzy.
Podsumowanie
Opinie klientów
5 | 50 % | |
4 | 50 % | |
3 | 0 % | |
2 | 0 % | |
1 | 0 % |


![Logo „[Stellar Strategies] Smart ADX”](https://cdn.ctrader.com/image/webp/af13b084-b6f6-41db-b7bc-c7e688b57b05_36929)


