
SR COMMANDER — Edycja wielookresowa
Zobacz, gdzie duże pieniądze wyznaczają granicę. Handluj na swoim interwale. Myśl na ich.
Większość narzędzi wsparcia i oporu jest powiązana z interwałem wykresu. Jeśli skalpujesz na M1, twoje poziomy S/R pochodzą ze świec M1 — małych, hałaśliwych i łatwych do sfałszowania. SR Commander MTF przełamuje ten łańcuch.
Ustaw swój wykres na M1. Ustaw interwał SR na H1. Teraz skalpujesz z precyzją wykresu minutowego, ale twoje poziomy wsparcia i oporu są rysowane na podstawie świec godzinowych, gdzie instytucje, algorytmy i profesjonalni traderzy faktycznie podejmują decyzje. To jest przewaga.
JAK DZIAŁA SILNIK WIELOOKRESOWY
Indykator uruchamia dwa niezależne strumienie danych jednocześnie.
Twój interwał wykresu kontroluje to, co widzisz — twoje świece, wejścia, strzałki, timing. Twój interwał SR kontroluje, skąd pochodzą poziomy. Te dwa strumienie są mapowane względem siebie w czasie rzeczywistym, świeca po świecy. Gdy zamyka się nowa świeca wykresu, SR Commander wyszukuje odpowiednią świecę interwału SR na ten dokładny moment i przelicza poziomy na podstawie struktury wyższego interwału.
Oznacza to, że twoja zielona linia wsparcia i czerwona linia oporu zawsze odzwierciedlają strukturę ważoną zmiennością wybranego interwału SR — a nie szum wykresu, który oglądasz.
NAUKA STOJĄCA ZA POZIOMAMI
SR Commander nie rysuje linii tylko na szczytach i dołkach. Używa modelu zmienności Yang-Zhang — tej samej klasy estymatora zmienności używanego w profesjonalnych badaniach ilościowych — do obliczenia prawdziwej statystycznej wagi każdej świecy. Każdy poziom pochodzi ze znormalizowanej struktury cenowej, uwzględniając luki nocne, ruch od otwarcia do zamknięcia oraz zakres wewnątrz świecy. Efektem są poziomy o rzeczywistym matematycznym znaczeniu, a nie tylko wizualnej wyrazistości.
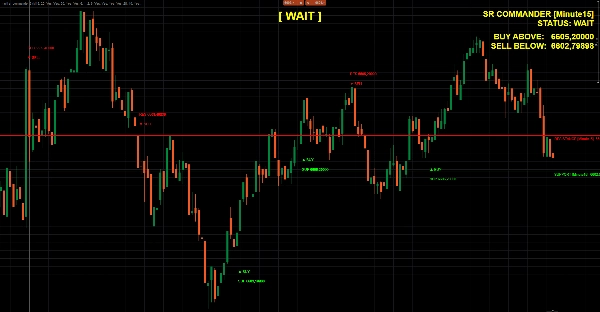
CO WIDZISZ NA WYKRESIE
- 🟢 Zielona linia wsparcia — najbliższa statystycznie istotna podłoga poniżej obecnej ceny, pochodząca z wybranego interwału SR
- 🔴 Czerwona linia oporu — najbliższy statystycznie istotny sufit powyżej obecnej ceny, pochodzący z wybranego interwału SR
- ⬆️ Sygnał KUPNA — pojawia się, gdy cena odbija się od wsparcia z potwierdzonym byczym zamknięciem świecy interwału SR
- ⬇️ Sygnał SPRZEDAŻY — pojawia się, gdy cena odrzuca opór z potwierdzonym niedźwiedzim zamknięciem świecy interwału SR
- 📊 Panel na żywo — pokazuje aktywny interwał SR, aktualny status i dokładne ceny wyzwalające wybicie
- 🔵 Duża etykieta statusu — KUP / SPRZEDAJ / CZEKAJ, aktualizowana co świecę na środku u góry wykresu
- 🕓 Nakładka historyczna — odbicia, odrzucenia, wybicia i załamania oznaczone na wykresie dla natychmiastowej wizualnej weryfikacji
DZIAŁAJĄCE KOMBINACJE INTERWAŁÓW
Interwał wykresuInterwał SRPrzypadek użycia
M1
M5 lub M15
Szybkie skalpowanie ze strukturą krótkoterminową
M5
H1
Trading wewnątrz dnia z poziomami godzinowymi
M15
H4
Wejścia swingowe ze strukturą 4-godzinną
H1
D1
Trading pozycyjny na podstawie dziennych poziomów S/R
Dowolny
Wykres
Tryb klasyczny — oryginalne zachowanie pojedynczego interwału
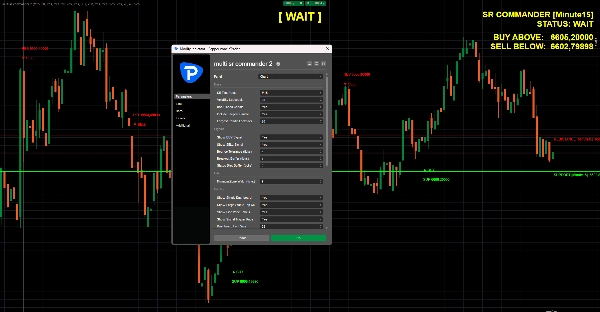
CECHY
- Pełny silnik wielookresowy — dowolny interwał SR na dowolnym interwale wykresu
- Obliczenia poziomów znormalizowane zmiennością Yang-Zhang
- Uwzględnianie największej świecy — zawsze obejmuje dominującą świecę struktury z okresu analizy
- Logika sygnałów odbicia i odrzucenia z konfigurowalną tolerancją i buforem
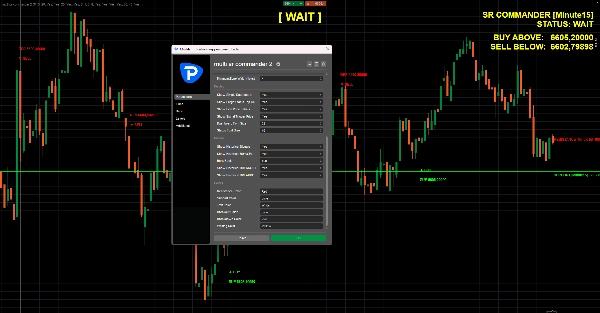
- Wykrywanie wybicia i załamania z regulowanym buforem
- Nakładka sygnałów historycznych dla natychmiastowej weryfikacji na wykresie
- Panel i duża etykieta statusu z w pełni konfigurowalnymi rozmiarami i kolorami czcionek
- Zero repaint — wszystkie sygnały oparte na zamkniętych świecach, gdy tryb potwierdzenia jest aktywny
DLA KOGO TO JEST?
Traderzy, którzy rozumieją, że najlepsze wejścia są na niższych interwałach, ale najlepsze poziomy na wyższych. Jeśli kiedykolwiek rysowałeś poziomy H4 ręcznie podczas handlu na M5 — SR Commander automatyzuje cały ten proces, utrzymuje go na matematycznych podstawach i umieszcza sygnał bezpośrednio na twoim wykresie w momencie reakcji ceny.
Struktura wyższego interwału. Precyzja niższego interwału. Jeden indykator.
5 | 50 % | |
4 | 50 % | |
3 | 0 % | |
2 | 0 % | |
1 | 0 % |


