
설명
✅ 부드러운 색상 변화 추세선이 방향에 즉시 적응합니다
✅ 선택 가능한 상향 및 하향 화살표로 명확한 추세 전환 신호 제공
✅ 노이즈를 필터링하여 깨끗하고 신뢰할 수 있는 추세 전환을 강조합니다
✅ 추세 추종, 되돌림 및 반전에 이상적입니다
✅ 완전한 사용자 정의 가능: 기간, 민감도 및 화살표 표시
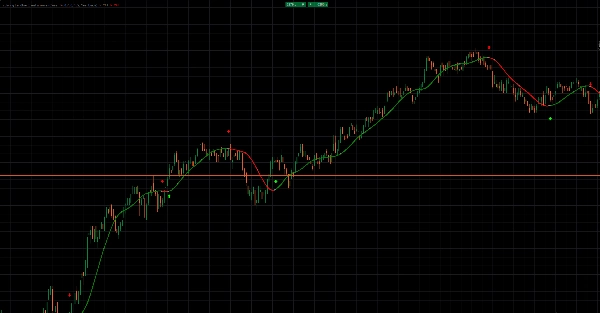
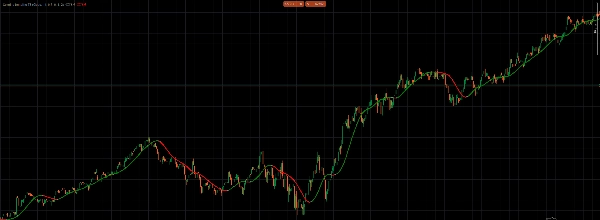
이 화살표가 있는 색상 추세선은 시장 방향을 부드럽고 반응성 있게 보여주며 불필요한 요소가 없습니다.
추세선은 강세 구간에서 녹색으로, 약세 구간에서는 빨간색으로동적으로 변해 추세 방향을 즉시 읽을 수 있게 합니다.
모멘텀이 전환될 때, 선택적 화살표가 변화를 표시합니다 — 상승 추세에는 녹색 화살표, 하락 추세에는 빨간 화살표.
이를 통해 시장 노이즈로 인한 잘못된 신호를 피하면서 추세 전환을 조기에 포착할 수 있습니다.
명확성을 위해 설계되었으며, 가격에 부드럽게 적응하면서 강력한 방향 구조를 유지합니다.
진입 타이밍, 청산 관리 및 주요 추세에 맞춰 움직이기에 완벽합니다.
독립적인 추세 도구로 사용하거나 기존 전략과 결합하여 추가 확인용으로 활용하세요.
깔끔한 시각 효과. 명확한 신호. 자신감 있는 추세 거래.
요약
AI 요약
The Coloring Trendline with Arrows indicator provides a smooth, color-changing trendline that dynamically shifts green during bullish phases and red during bearish phases, offering an immediate visual of market direction. It incorporates a triple-EMA (T3MA) calculation blending six cascaded EMAs with a customizable volume factor to reduce lag and filter noise, enhancing trend signal clarity. Users can adjust sensitivity through period and volume factor inputs and set thresholds for clean trend confirmations. Optional up and down arrows mark trend shifts—green arrows indicate uptrends, red arrows signal downtrends—helping to identify trend pivots early while minimizing false signals. Designed for clarity and responsiveness, this indicator is suitable for trend following, pullbacks, and reversals. It can be used standalone or combined with other strategies to assist in timing entries and managing exits aligned with dominant trends. The indicator supports customization of period, sensitivity, and arrow display options.
지표 프로필
고객 리뷰
4.0
리뷰: 1
5 | 0 % | |
4 | 100 % | |
3 | 0 % | |
2 | 0 % | |
1 | 0 % |
고객 리뷰
July 11, 2025
The small win here is it gives the trade idea another check. It should not replace the chart.
상담
자주 묻는 질문(FAQ)
Signal
Breakout
Scalping
SMC
Grid
AI
Martingale
트레이딩 봇, 지표, 플러그인 등 cTrader Store에서 제공되는 상품은 제3자 개발자에 의해 제공되며, 이는 단순히 정보 및 기술적 접근을 목적으로 제공된 것입니다. cTrader Store는 중개인이 아니며, 투자 조언, 개인별 추천 또는 향후 성과에 대한 어떠한 보장도 제공하지 않습니다.
이 작성자의 상품 더 보기


좋아하실 만한 다른 항목


!["[Stellar Strategies] Inside Bar with Signals" 로고](https://cdn.ctrader.com/image/webp/1d9e8bfa-3b2c-4440-bb37-5856902008a7_30683)


가격
59
판매
923
무료 설치