
설명
🔧 ATR_RR_SignalPanel — 기술적 및 상세 설명 (EN) 🧠📈
ATR_RR_SignalPanel 은 cTrader용 오버레이 지표로, 빠른 EMA 대 느린 EMA 체계를 사용하여 추세 전환 진입 신호를 생성한 후, ATR 기반 위험 크기 조정과 구성 가능한 위험:보상 배수를 사용하여 완전한 가상 거래 프레임워크(진입 🏁, 손절 🛑, 최종 이익 실현 🎯, 중간 목표 🟢)를 구축합니다.
🧭 핵심 로직 (신호 엔진) 🚦
- 지표는 다음을 계산합니다:
-
- 빠른 EMA ⚡ 및 느린 EMA 🐢 를 종가 기준으로.
- ATR (와일더 평활) 🌡️ 변동성 기반 손절 거리 측정용.
- 추세 체계는 다음과 같이 정의됩니다:
-
- 강세 추세 🟢 는
빠른 EMA > 느린 EMA - 약세 추세 🔴 는
빠른 EMA < 느린 EMA
- 강세 추세 🟢 는
- 추세 전환 🔁은 강세/약세 상태가 이전 봉과 다를 때 발생합니다 (Pine의
bullTrend != bullTrend[1]와 동일).
🎯 진입 조건 (매수/매도) 🟩🟥
추세 전환이 발생하면:
- 매수 신호 🟢 는 다음과 같습니다:
-
- 강세 추세가 활성화되어 있고 추세 전환이 감지될 때
- 선택적 캔들 확인 ✅: 종가 > 시가 (강세 캔들)
- 매도 신호 🔴 는 다음과 같습니다:
-
- 약세 추세가 활성화되어 있고 추세 전환이 감지될 때
- 선택적 캔들 확인 ✅: 종가 < 시가 (약세 캔들)
🧪 가상 포지션 관리 (cBot 아님) 🧩
이 지표는 주문을 하지 않고 대신 내부 “가상 포지션”을 시뮬레이션합니다:
- 새로운 매수/매도 신호가 발생하면 다음을 설정합니다:
-
- 진입 가격 = 현재 종가 🏁
- 손절가 = 캔들 극값 ± ATR × 배수 🛑
- 최종 이익 실현가 = 진입가 ± (위험 × 위험:보상) 🎯
- 중간 TP 레벨 = 1R, 2R, … floor(RR)-1 까지 단계별 🟢
- 가격 움직임을 봉 단위로 모니터링합니다:
-
- 최종 TP에 닿으면 ➜ 표시 🎯 후 가상 포지션 종료 ✅
- 손절가에 닿으면 ➜ 표시 🛑 후 가상 포지션 종료 ❌
- 중간 TP 도달은 한 번만 추적 🧷
🔁 무효화 로직 (활성 중 반대 신호) ⚠️
반대 방향의 가상 거래가 존재하는 동안 새 신호가 도착하면:
- 이전 진입은 무효화됨 ⚠️ (무효 매수 / 무효 매도)
- 이전 가상 포지션은 종료됨 🧯
- 새 가상 포지션이 새 방향으로 생성됨 🔄
🧼 다중 인스턴스 안전 (동일 차트 내 여러 복사본) 🧩🧩
각 지표 인스턴스는 고유 내부 ID 🆔를 생성하므로:
- 한 인스턴스의 선/텍스트가 다른 인스턴스를 덮어쓰지 않습니다 ✅
- 여러 구성을 병행 실행할 수 있습니다 (예: 스캘핑 + 스윙) 🧠📊
🧯 잡음 제거 제어 (마커 제한기) 🧹✨
차트를 읽기 쉽게 유지하기 위해 다음을 수행할 수 있습니다:
- 그려지는 텍스트 마커 수 제한 (매수/매도/TP/SL/무효/TP1…) 🧾
- 제한 초과 시 오래된 마커 자동 삭제 ♻️
🧷 선택적 “마지막 위험선 유지” 🧠📌
활성화 시 마지막 진입/손절/이익 실현선이 TP/SL 종료 후에도 표시됩니다:
- 거래 후 검토에 유용 🧑🔬
- 저널링에 적합 📒✅
⚙️ 매개변수 — 상세 설명 (EN) 🔍📌
📈 신호 및 위험 핵심
⚡ 빠른 EMA
- 기능 🧠: 체계 변화를 감지하는 데 사용되는 빠른 EMA 기간을 설정합니다.
- 효과 📊: 낮은 값 = 더 민감 ➜ 신호 증가; 높은 값 = 부드러움 ➜ 신호 감소.
- 일반 범위 🎛️: 빠른 시장용 3–10 ⚡, 안정적 환경용 10–20 🐢
🐢 느린 EMA
- 기능 🧠: 추세 기준선으로 사용되는 느린 EMA 기간을 설정합니다.
- 효과 📊: 느린 EMA가 높을수록 필터링 강도 증가 ➜ 추세 전환 신호 감소.
- 일반 범위 🎛️: 스타일에 따라 13–55 🧭
🌡️ ATR 기간
- 기능 🧠: ATR의 변동성 측정 길이를 제어합니다.
- 효과 📏: 짧은 ATR은 빠르게 반응 (더 타이트한 SL), 긴 ATR은 안정적 (더 안정적인 SL).
- 일반 범위 🎛️: 10–21이 일반적 ✅
🛑 SL 배수 (ATR)
- 기능 🧠: ATR 단위로 손절 거리 정의.
- 롱 🟢:
SL = Low - ATR * Mult - 숏 🔴:
SL = High + ATR * Mult - 효과 🎯: 배수가 높으면 SL이 넓어짐 (손절 적음, 위험 큼); 낮으면 SL이 타이트함 (손절 많음).
- 일반 값 🎛️: 변동성에 따라 0.3–2.0 🌪️
⚖️ 위험:보상 (R:R)
- 기능 🧠: 최종 TP 계산을 위해 “위험” 거리에 배수를 곱합니다.
- 공식 📌:
-
- 위험 = |진입 − SL|
- 최종 TP = 진입 ± 위험 × RR 🎯
- 중간 TP 🟢: TP1은 1R, TP2는 2R, … 최대
floor(RR)-1 - 예시 🧪: RR=3 ➜ TP1 (1R), TP2 (2R), 최종 TP (3R) 🎯🎯🎯
✅ 캔들 확인 필요
- 기능 🧠: 신호 봉에서 캔들 방향 검증을 추가합니다.
- 매수 🟢: 종가 > 시가 필요
- 매도 🔴: 종가 < 시가 필요
- 효과 🧽: 약한 반전 필터링, 노이즈 감소, 진입 지연 가능 ⏳
📌 EMA 표시
👁️ 빠른 EMA 표시
- 기능 🧠: 빠른 EMA 선을 표시하거나 숨깁니다.
- 사용 사례 💡: 깔끔한 차트를 원할 때 숨기기 🧼
👁️ 느린 EMA 표시
- 기능 🧠: 느린 EMA 선을 표시하거나 숨깁니다.
- 사용 사례 💡: 추세 맥락을 위해 표시 유지 🧭
🎛️ 시각적 제어 (잡음 관리) 🧹✨
🚦 신호 표시
- 기능 🧠: 매수/매도 마커를 표시하거나 숨깁니다.
- 포함 🧷: 매수 🟢 / 매도 🔴 마커만
- 팁 💡: “선만” 모드에서는 비활성화 📏
🏷️ TP 라벨 표시
- 기능 🧠: TP1, TP2 등 라벨을 표시하거나 숨깁니다.
- 효과 🧼: 끄면 높은 TF에서 텍스트 잡음 감소 📉
- 참고 🧷: 라벨은 TP 도달 시 한 번만 표시 ✅
⚠️ 무효화 표시
- 기능 🧠: 무효 매수 / 무효 매도 마커를 표시하거나 숨깁니다.
- 사용 사례 🧠: 신호 반전을 연구할 때 유용 🔁
🎯🛑 최종 TP/SL 표시
- 기능 🧠: 최종 TP 및 SL 마커를 표시하거나 숨깁니다.
- 사용 사례 📒: 결과 분포 검토에 적합 🎲
📏 위험선 표시 (진입/SL/TP)
- 기능 🧠: 차트에 진입 🏁, 손절 🛑, 최종 TP 🎯 선을 그립니다.
- 효과 📌: 가상 거래 구조를 즉시 시각화 🧠
🟢 중간 TP 선 표시
- 기능 🧠: TP1/TP2/... 레벨에 점선 그리기.
- 팁 🧼: 차트가 너무 “녹색 스파게티” 같으면 비활성화 🍝🟢
📌 마지막 위험선 유지
- 기능 🧠: 가상 종료(TP/SL) 후 마지막 진입/SL/TP 선을 표시 상태로 유지합니다.
- 유용성 📒: 저널링 및 거래 후 분석에 완벽 🧑🔬✅
🧾 차트 내 최대 마커 수 (0=무제한)
- 기능 🧠: 지표가 차트에 남기는 텍스트 객체 수를 제한합니다.
- 작동 방식 ♻️: 제한 초과 시 가장 오래된 마커를 자동으로 제거합니다.
- 권장 🎛️: 시간 프레임 및 기록 깊이에 따라 80–200 🕰️
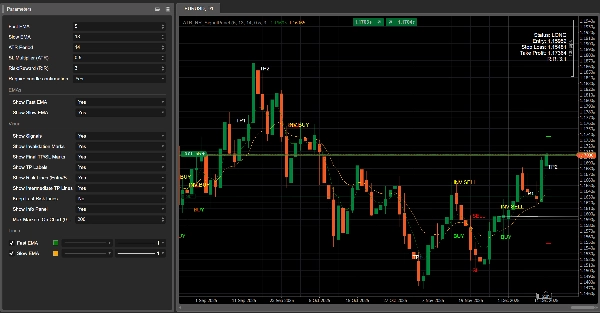
🧾 정보 패널 표시
- 기능 🧠: 차트에 간결한 상태 패널을 표시합니다.
- 표시 내용 📋: 상태 (롱/숏/포지션 없음), 진입, SL, TP, 계산된 RR.
요약
The indicator simulates virtual trades by setting entry price, stop loss, and take profit levels using Average True Range (ATR) for volatility-based risk sizing combined with a configurable risk-to-reward multiplier. It tracks intermediate take profit levels and monitors price action bar-by-bar to mark virtual trade outcomes without placing actual orders.
Key features include optional candle confirmation for signals, multi-instance support to run multiple configurations on the same chart, and visual clutter controls such as limiting markers and toggling display of EMAs, signals, and risk lines. An info panel provides a compact status overview of virtual positions. Parameters allow customization of EMA periods, ATR period, stop loss multiplier, and risk-reward ratio to adapt to different trading styles and market conditions.
Supported markets include Forex, indices, commodities, stocks, and cryptocurrencies, with symbols like GBPUSD, EURUSD, XAUUSD, NAS100, and BTCUSD among the tagged assets.
고객 리뷰
5 | 100 % | |
4 | 0 % | |
3 | 0 % | |
2 | 0 % | |
1 | 0 % |


