
Opis
Wskaźniki Pinescriptlabs Store: Pinescriptlabs Store cBoty : (cBot) Gold & BTC BreakoutSession Pivots(nowy)
PRICE ACTION (Nowy)
Trailing Smart Algorithm (nowy)
Prognoza oparta na Linreg & ATR
SmartTrend Wsparcie &
Opór
Linie
Dynamiczna
Struktura Rynku
Analiza
Punktów
Zwrotu
Obrotu
Fibonacci
Regresja
Liniowa
Wielookresowa
Wielopoziomowy
Tracker Kierunku Świec
Tracker
Auto
Wsparcie i
Opór
Trend
Linie
Wszystkie
Poziomy wsparcia i
oporów
Poziomy
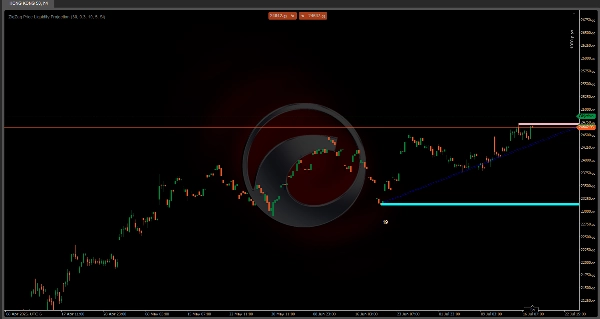
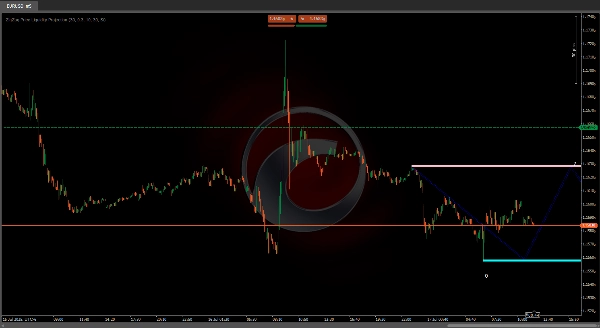
📊 Wskaźnik Projekcji Płynności Ceny ZigZag
"Zobacz, gdzie rynek może się odwrócić, zanim to nastąpi!" 🔮
Ten wskaźnik identyfikuje kluczowe poziomy wsparcia/oporu 🛑 oraz prognozuje strefy płynności 💧 na twoim wykresie, wykorzystując:
- 🔍 Punkty Pivot: Wykrywa istotne maksima i minima
- 📈 Zmienność ATR: Mierzy wahania cen dla precyzyjnego dostrojenia
- 💦 Projekcje płynności: Przewiduje obszary o dużej aktywności (klastry kupna/sprzedaży) za pomocą wzorców zigzag
🎯 Cel: Prognozuje strefy reakcji cen (odbicia/przełamania/konsolidacje) w celu poprawy decyzji wejścia/wyjścia
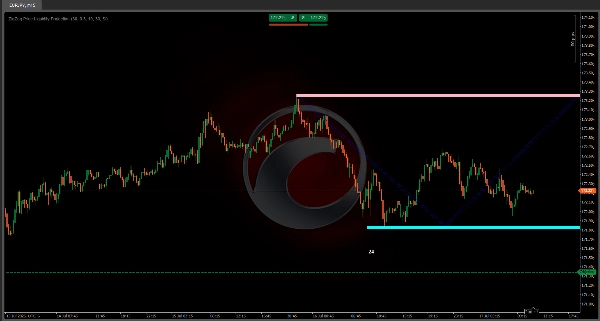
✨ Zaleta Zigzag
Te połączone linie działają jak mapa skarbów 🗺️ pokazując:
1️⃣ Przyszłe ścieżki cenowe w określonych zakresach
2️⃣ Potencjalne strefy odwrócenia gdzie cena może się zatrzymać lub odwrócić
3️⃣ Wizualne punkty odniesienia do planowania transakcji
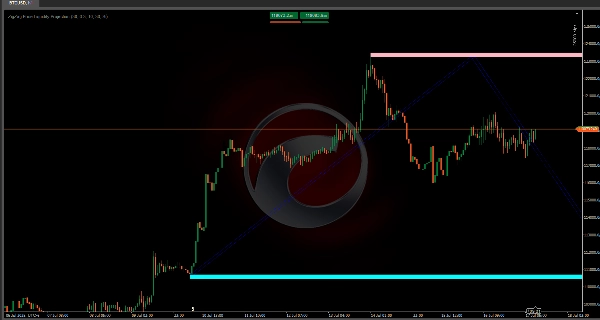
🚦 Kluczowe funkcje:
- 📅 System wczesnego ostrzegania dla ważnych poziomów
- 🎯 Prognozuje przyszłe ruchy na podstawie struktur pivot (ścieżki bycze/niedźwiedzie)
- 🔢 Liczniki dotknięć (np. "24" = 24 historyczne testy na tym poziomie)
⚙️ Zalecane ustawienia
UstawienieWartośćEfekt
Okres ATR
30
🎚️ Czułość na zmienność
Okres Pivot
30
🔍 Zakres znaczenia pivot
⏳ Najlepsze interwały czasowe: wykresy 15min - 4h ⏱️
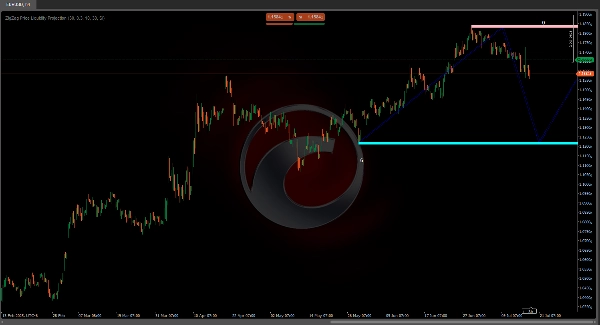
💡 Profesjonalna wskazówka:
"Łącz z formacjami świecowymi 🕯️ dla potwierdzenia! Zigzag pokazuje GDZIE cena może pójść, świece pokazują KIEDY to się dzieje."
🎯 Ostateczne wnioski:
Potężne wszechstronne narzędzie wizualne do wykrywania:
✅ Stref płynności 💦
✅ Krytycznych poziomów 🎯
✅ Przyszłych ścieżek cenowych 🚀
Idealne dla traderów intraday, którzy chcą przewidywać ruchy zamiast je gonić! 🏃💨


