
الوصف
مؤشرات متجر Pinescriptlabs: روبوتات متجر Pinescriptlabs : (cBot) اختراق الذهب و BTCمحاور الجلسة(جديد)
حركة السعر (جديد)
دعم SmartTrend &
المقاومة
خطوط
تحليل
هيكل السوق الديناميكي
لـ
نقاط
الانعطاف
فيبوناتشي
انحدار خطي
متعدد الأطر الزمنية
متعدد الأطر الزمنية
متعدد المستويات
متعصب الشمعة
المتعقب
دعم تلقائي و
مقاومة
اتجاه
خطوط
جميع
مستويات الدعم و
المقاومة
المستويات
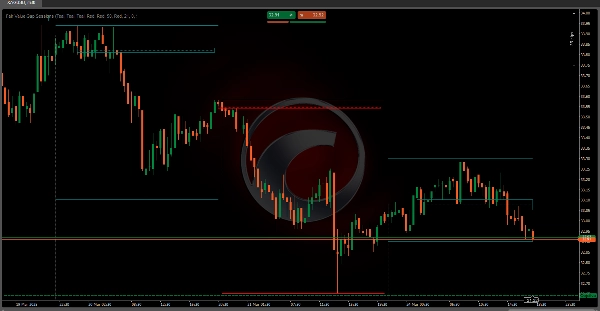
جلسات فجوة القيمة العادلة 📊💰
مؤشر فجوة القيمة العادلة (FVG) هو أداة تداول متطورة مصممة لتحديد وتسليط الضوء على عدم كفاءات السوق المؤقتة المعروفة باسم "فجوات القيمة العادلة" 🚨 داخل جلسات تداول محددة. تمثل هذه الفجوات لحظات يتحرك فيها سعر السوق بسرعة ⚡، مما يخلق اختلالًا بين المشترين والبائعين.
آليات تقنية رئيسية 🔧
هيكل قائم على الجلسة 🕒
• ينفذ نهج تحليل دقيق وقابل للتكوين قائم على الجلسة
• يسمح للمتداولين بتحديد أوقات بدء الجلسة المخصصة مع دعم توقيت UTC أو المنطقة الزمنية المحلية 🌍
• ينشئ حدًا ديناميكيًا للجلسة يعيد التعيين ويتتبع سلوك السوق 🔄
منطق اكتشاف فجوة القيمة العادلة 🔎
• يستخدم تحليل حركة السعر المتقدم عبر عدة أشرطة سعرية متتالية
• يحدد الفجوات من خلال مقارنة:
o أسعار أعلى وأدنى شريط متتالي 📈📉
o سعر إغلاق الشريط السابق ✅
o هيكل سعر الشريط الحالي 🔄
تصنيف الفجوات 🏷️
يميز المؤشر بين نوعين رئيسيين من الفجوات:
- فجوة القيمة العادلة الصعودية 📈
o تحدث عندما يقفز السعر فوق الأعلى السابق 🔺
o تشير إلى زخم سوق صاعد محتمل 🚀
o تشير إلى ضغط شراء محتمل 💸 - فجوة القيمة العادلة الهبوطية 📉
o تحدث عندما ينخفض السعر تحت الأدنى السابق 🔻
o تشير إلى زخم سوق هابط محتمل ⬇️
o تشير إلى ضغط بيع محتمل 🛑
تطبيقات التداول 📱💼
رؤى استراتيجية 💡
• يساعد المتداولين على تصور عدم كفاءات السوق 🖼️
• يوفر تحذيرًا مبكرًا من احتمالية انعكاسات الاتجاه ⚠️
• يقدم تحديدًا دقيقًا لنقاط الدخول والخروج 🎯
ميزات إدارة المخاطر 🛡️
• تصور ملون لحالات الفجوة 🎨
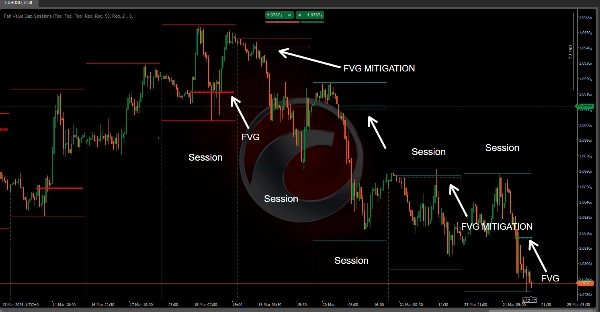
• يتتبع "تخفيف" الفجوة (عندما يعود السعر إلى منطقة الفجوة) ↔️
• يسمح بإعدادات ألوان قابلة للتخصيص لظروف السوق المختلفة 🎨
التصور الفني 🎨
ينشئ المؤشر عنصرين بصريين رئيسيين:
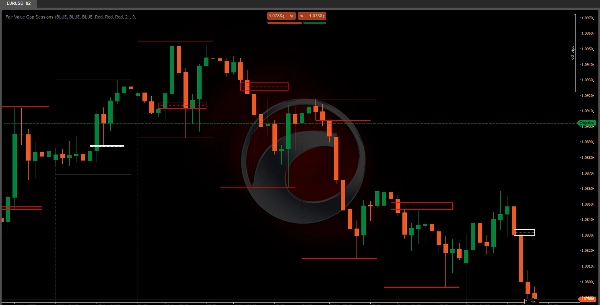
- مستطيل منطقة الفجوة 🟩
o يمثل نطاق سعر الفجوة المحددة 📐
o يمتد ديناميكيًا طوال جلسة التداول ➡️
o يغير اللون بناءً على حالة الفجوة (نشطة/مخففة) 🟩➡️🟨 - خط المستوى 📏
o موضوع في منتصف الفجوة ⚫
o يساعد المتداولين على تحديد منطقة السعر المركزية للفجوة بسرعة 📍
o يستخدم أنماط خطوط مختلفة للدلالة على حالة الفجوة ➔
استراتيجيات تداول عملية 📝
استراتيجيات إشارة الدخول 🚦
• استخدم اكتشاف الفجوة كإشارة محتملة لاستمرار الاتجاه 🔄
• ابحث عن عودة السعر إلى (تخفيف) الفجوة كإثبات ✅
• اجمع مع مؤشرات تقنية أخرى لاتخاذ قرارات قوية 🤝
تقنيات إدارة المخاطر 🛡️
• ضع وقف خسارة بالقرب من حدود الفجوة ⛔
• استخدم منتصف الفجوة كمستوى دعم/مقاومة محتمل 🪜
• راقب تخفيف الفجوة كمؤشر محتمل لانعكاس الاتجاه ↔️⚠️
مرونة التكوين ⚙️
• وقت بدء الجلسة قابل للتخصيص ⏰
• تكوين المنطقة الزمنية (UTC/محلي) 🌍
من خلال فهم وتنفيذ مؤشر جلسات فجوة القيمة العادلة بشكل صحيح، يمكن للمتداولين الحصول على رؤى أعمق في ديناميكيات السوق، وتحديد فرص تداول محتملة، واتخاذ قرارات أكثر وعيًا بناءً على عدم كفاءات حركة السعر. 🧠📈
الملخص
It classifies gaps into two types: bullish gaps, indicating potential upward momentum and buying pressure, and bearish gaps, signaling possible downward momentum and selling pressure. Visually, it represents gaps with dynamic rectangles showing the price range and a midpoint level line to help traders quickly locate the gap's central price zone. Colors and line styles change to reflect the gap's active or mitigated status.
Traders can use this tool to visualize market inefficiencies, receive early warnings of trend reversals, and identify precise entry and exit points. Risk management features include color-coded gap states, tracking of gap mitigation when price returns to the gap zone, and customizable color settings. The indicator supports practical strategies such as using gap detection for trend continuation signals and combining it with other indicators for decision-making. Stop-loss placement near gap boundaries and monitoring gap mitigation for trend reversal are also supported.
تقييمات العملاء
5 | 100 % | |
4 | 0 % | |
3 | 0 % | |
2 | 0 % | |
1 | 0 % |


