
Deskripsi
Pinescritlabs Ctrader Store indikator :
Dynamic Market Structure
Analisis Titik Balik
Fibonacci Linear
Regresi Multi-timeframe
Multi-Level Candle Bias
Tracker
Auto Support and
Resistance Trend Lines
All Support and
Resistance Levels
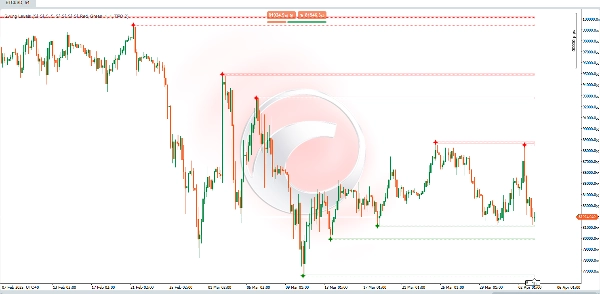
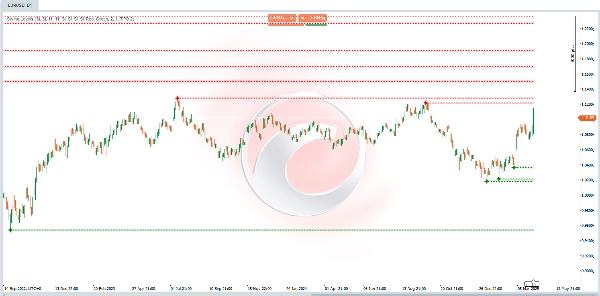
🔍 Level Ayunan
Indikator ini dirancang untuk secara otomatis mendeteksi level support dan resistance berdasarkan "ayunan" atau pivot pada grafik (yaitu, titik tertinggi dan terendah yang signifikan). Setelah titik-titik ini diidentifikasi, indikator menggambar garis atau zona (persegi panjang) yang berfungsi sebagai referensi utama untuk aksi harga dan keputusan trading.
🛠 Fitur Utama:
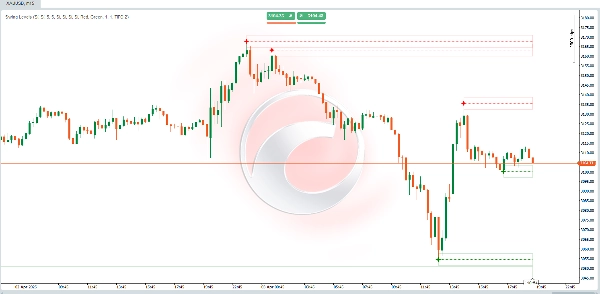
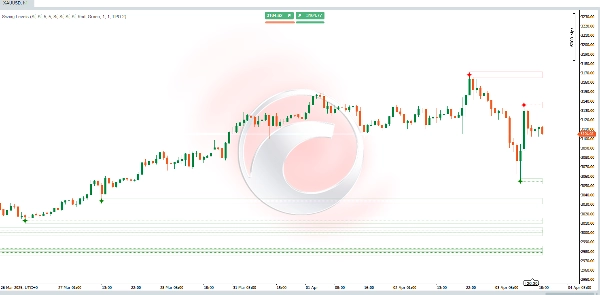
✅ Identifikasi Level Kunci: Ini menyoroti di mana ayunan tertinggi dan ayunan terendah terbaru telah terbentuk. Level-level ini sering berfungsi sebagai support atau resistance di masa depan.
✅ Analisis Struktur Pasar: Membantu memvisualisasikan apakah pasar membentuk harga tertinggi dan terendah yang lebih tinggi (bullish) atau harga tertinggi dan terendah yang lebih rendah (bearish)—penting untuk identifikasi tren dan potensi titik pembalikan.
✅ Alat Pengambilan Keputusan: Trader dapat menggunakan level-level ini untuk menentukan titik masuk, penempatan stop-loss, atau zona take-profit, memanfaatkan support dan resistance yang dinamis.
🧠 Bagaimana Cara Kerjanya?
1️⃣ Deteksi Pivot (Ayunan Tinggi & Ayunan Rendah)
📌 Indikator menganalisis sejumlah candle/bar yang ditentukan ke kiri dan kanan (parameter: "Left Bars" & "Right Bars").
📌 Untuk mendeteksi Ayunan Tinggi, indikator memeriksa apakah harga tertinggi dari bar tengah (pivot potensial) lebih tinggi daripada harga tertinggi dari bar-bar tetangga dalam rentang tersebut.
📌 Untuk mendeteksi Ayunan Rendah, indikator menerapkan logika yang sama tetapi membandingkan harga terendah sebagai gantinya.
📊 Menginterpretasikan Level yang Digambar:
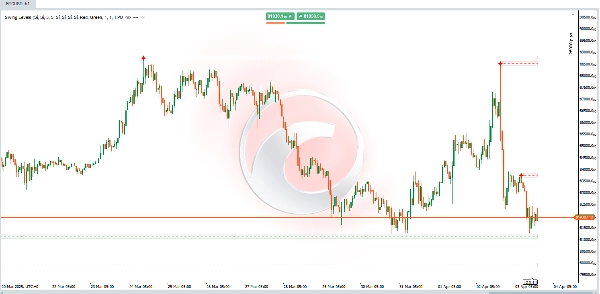
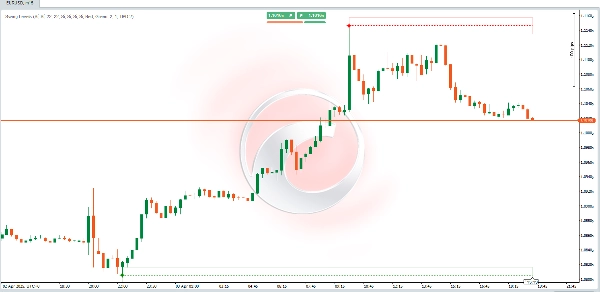
🔴 Ayunan Tinggi → Zona Resistance Potensial:
- Jika harga kembali ke level ini, perhatikan penolakan (penjualan) atau breakout (kelanjutan bullish).
🟢 Ayunan Rendah → Zona Support Potensial:
- Jika harga mengunjungi kembali level ini, amati pantulan (pembelian) atau penurunan (kelanjutan bearish).
Ringkasan
Key features include:
- Identification of recent swing highs and lows, which often act as future support or resistance.
- Visualization of market structure by highlighting patterns of higher highs and lows (bullish) or lower highs and lows (bearish), aiding trend recognition and reversal detection.
- A decision-making tool for traders to set entry points, stop-losses, and take-profit zones based on dynamic support and resistance.
Swing highs indicate potential resistance zones where price may reject or break out, while swing lows indicate potential support zones where price may bounce or break down. This indicator supports analysis across various markets and timeframes by providing clear visual cues of market turning points.
Ulasan pelanggan
5 | 0 % | |
4 | 100 % | |
3 | 0 % | |
2 | 0 % | |
1 | 0 % |


