
Deskripsi
🚀 Lebih dari 10.000 trader sudah menggunakan indikator TOP kami🏆
Temukan mengapa para profesional memilih kami – alat paling kuat di cTrader (indikator, algoritma, dan cBots) menunggu Anda.
👉 Dapatkan semua sistem TOP kami di sini:
_______________________________________________
_______________________________________________
📌 Indikator Struktur Pasar
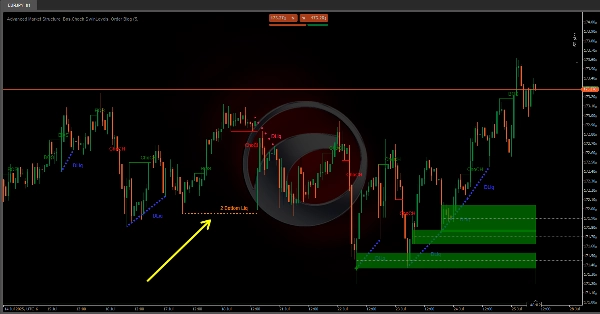
· ✅ AdvancedMarket Structure: Bos, Choch, SwinLevels, Order Blocks, Market Structure& Liquidity Finder
· 🔄 Dynamic Market StructureAnalysis of Turning Points
· 🧱 Order Block
· ⚖️ Market Imbalance
· ⛓️ BOS & CHOCH
· 🧠 ICT Power of 3
______________________________________________________________-
Store cBots : 🧠 Gold & BTC BreakoutSession Pivots 🧠
_______________________________________________
🔚 Sistem Keluar Pintar
_______________________________________________
📐 Indikator ZigZag
· 🔍 ZigZag Price LiquidityProjection
· ➖ ZigZag
_______________________________________________
🧱 Indikator Support & Resistance
· 🟩 SmartTrend Support &Resistance Lines
· 🧱 All Support and ResistanceLevels
_______________________________________________
📊 Indikator Tren & Saluran
· 📊 Supertrend
_______________________________________________
💧 Alat Volume & Likuiditas
_______________________________________________
⚡ Indikator Momentum & RSI
· 🔎 Multi-Level Candle BiasTracker
_______________________________________________
🔮 Alat Prediksi & Proyeksi
· 📐 Prediksi Berdasarkan Linreg& ATR
· 📏 Fibonacci Linear RegressionMulti-timeframe
· 📈 Volume-Powered Market Flow Projector
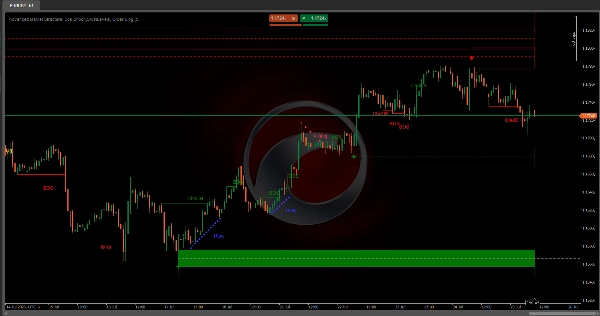
Advanced Market Structure: Bos, Choch, SwinLevels, Order Blocks, Market Structure & Liquidity Finder.
Apa Itu?
Sebuah alat aksi harga lanjutan yang menggabungkan beberapa konsep analisis teknikal menjadi satu indikator yang kuat. Mengintegrasikan:
- 📊 Struktur Pasar
- 🔄 Level Ayunan
- 🧱 Order Blocks
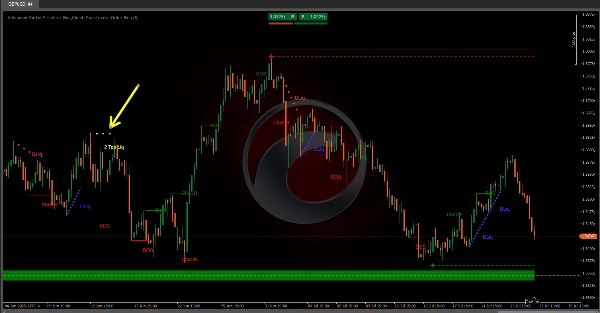
- 💧 Liquidity Finder (2 Bottoms & 2 Tops)
Tujuan: Mengidentifikasi titik masuk/keluar utama, tren, support/resistance, dan zona institusional di mana harga bereaksi.
🧠 Filosofi Inti: Smart Money
Pasar didorong oleh pelaku institusional (bank, dana, pembuat pasar) dengan sumber daya unggul. Mereka menciptakan pola untuk:
- 🕵️♂️ Menyembunyikan operasi selama akumulasi/distribusi.
- 🎯 Berburu likuiditas (stop loss ritel).
- 🚀 Memicu pergerakan eksplosif di pasar yang tidak seimbang.
🔑 Komponen:
1. Order Blocks
- Apa: Zona di mana institusi mengeksekusi pesanan besar, menciptakan ketidakseimbangan.
- Jenis:
-
- 🟢 Bullish (Permintaan): Pembelian institusional agresif.
- 🔴 Bearish (Penawaran): Penjualan institusional agresif.
- Sinyal Kunci: Harga memantul/berbalik di order blocks.
- Deteksi:
-
- Lonjakan volume dekat puncak (bearish) atau dasar (bullish).
2. Swing Levels
- Tujuan: Mendefinisikan struktur pasar melalui puncak/dasar utama.
- Break Kritis:
-
- 🔺 Break Swing High: Kelanjutan bullish.
- 🔻 Break Swing Low: Kelanjutan bearish.
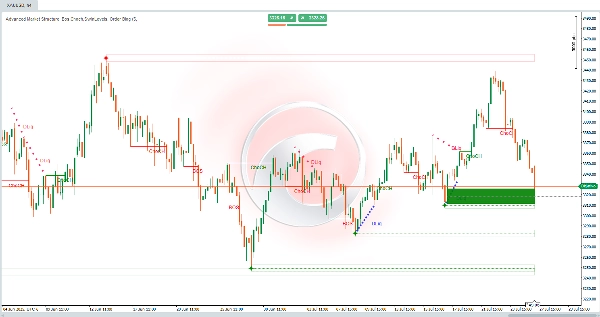
3. Break of Structure (BoS)
- Definisi: Break tegas dari swing high (bullish) atau low (bearish).
- Koneksi Fraktal:
-
- 🐂 Fraktal Bullish: Pola 5 lilin dengan low terendah di tengah.
- 🐻 Fraktal Bearish: Pola 5 lilin dengan high tertinggi di tengah.
4. Change of Character (ChoCh)
- Definisi: Pergeseran struktural yang menandakan pembalikan tren.
- Pemicu:
-
- Memecahkan swing low dalam tren naik (ChoCh bearish).
- Memecahkan swing high dalam tren turun (ChoCh bullish).
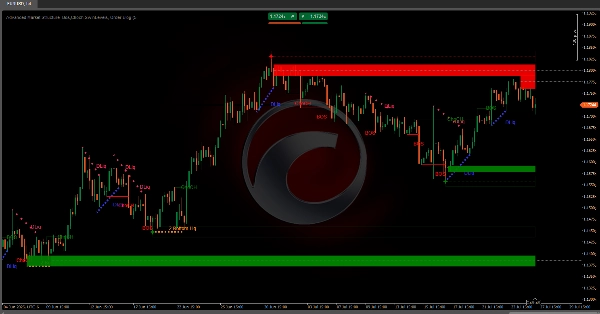
5. Zona Likuiditas
- Jenis:
-
- ⚖️ Statis: Level horizontal dengan puncak/dasar terkumpul (difilter ATR).
- 🏃 Dinamis: Garis tren yang menghubungkan pivot curam.
- Pola Kunci:
-
- 🕯️ 2 Tops/2 Bottoms: Perburuan stop institusional.
- ⛰️ Triple Tops/Bottoms: Zona kemacetan tinggi.
🎯 Aplikasi Kunci
- ✅ Mengidentifikasi tren/pembalikan melalui BoS/ChoCh.
- 📍 Menemukan support/resistance menggunakan level ayunan & zona likuiditas.
- 🏦 Menandai order blocks institusional.
- 🎯 Memprediksi target harga melalui zona likuiditas.
🔄 Strategi Smart Money
PhaseSignalsInstitutional Action
1. Akumulasi
ChoCh bullish + Demand order block 📈
Smart Money membeli
2. Markup
BoS berturut-turut + celah FVG 🚀
Ritel memicu momentum
3. Distribusi
ChoCh bearish di Likuiditas 2 Top 🎯
Smart Money menjual
4. Markdown
BoS bearish + likuidasi zona diskon 🔻
Perburuan stop di titik rendah
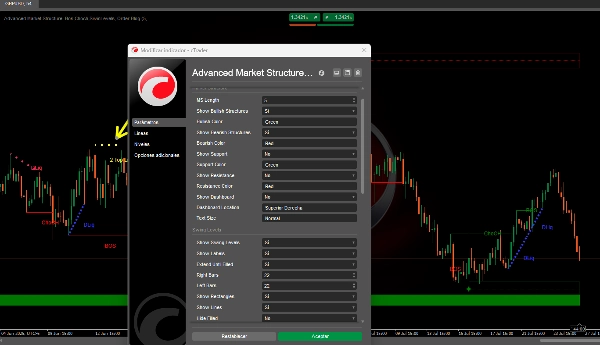
⚙️ Panduan Penyetelan Parameter
Struktur Pasar
MS Length:-
- ⬆️ Tingkatkan: Fraktal lebih sedikit tapi lebih dapat diandalkan.
- ⬇️ Turunkan: Lebih sensitif (risiko noise).
Level Ayunan
SwingSizeL/R:-
- ⬆️ Tingkatkan: Mengidentifikasi ayunan signifikan.
- ⬇️ Turunkan: Menangkap pembalikan kecil.
Extend Until Filled:-
- ✅ Diaktifkan: Level bertahan sampai harga mencapainya.
Order Blocks
Metode Mitigasi:-
- ✨
Wick: Sinyal lebih cepat (menyentuh wick). - 🎯
Close: Sinyal lebih kuat (menutup di luar blok).
- ✨
Liquidity Finder
Sensitivitas Statis/Dinamis:-
- ⬆️ Tingkatkan: Zona lebih sedikit (kualitas lebih tinggi).
- ⬇️ Turunkan: Zona lebih banyak (sensitivitas lebih tinggi).
Ringkasan
Key components include:
- **Order Blocks:** Zones of significant institutional buying (bullish) or selling (bearish) identified by volume spikes near highs or lows, signaling potential price rebounds or reversals.
- **Swing Levels:** Critical highs and lows defining market structure, with breaks indicating bullish or bearish continuations.
- **Break of Structure (BoS):** Decisive breaks of swing highs or lows, linked to fractal patterns, signaling trend direction.
- **Change of Character (ChoCh):** Structural shifts indicating trend reversals, triggered by breaking swing lows in uptrends or swing highs in downtrends.
- **Liquidity Zones:** Static (horizontal levels with clustered highs/lows) and dynamic (trendlines connecting pivots) zones highlighting institutional stop hunts and congestion areas.
The indicator supports smart money concepts, reflecting institutional market behavior phases: Accumulation, Markup, Distribution, and Markdown. Parameter tuning options allow adjustment of sensitivity and signal strength for Market Structure, Swing Levels, Order Blocks, and Liquidity Finder components. This tool aims to enhance market analysis by revealing institutional activity and improving trade decision-making.
Ulasan pelanggan
5 | 33 % | |
4 | 67 % | |
3 | 0 % | |
2 | 0 % | |
1 | 0 % |


