
HLC_Levels
Indikator
4 pembelian
Versi 1.0, Feb 2026
Windows, Mac
4.3
Ulasan: 3
Deskripsi
Deskripsi:
Berhenti menggambar garis secara manual setiap hari. Advanced HLC & Session Levels adalah indikator komprehensif yang dirancang untuk trader profesional yang mengandalkan titik referensi institusional. Apakah Anda berdagang Price Action, konsep ICT, atau strategi Breakout, alat ini menjaga grafik Anda tetap bersih dan level Anda tepat.
Fitur Utama:
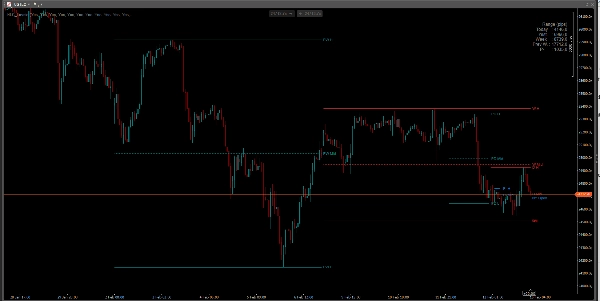
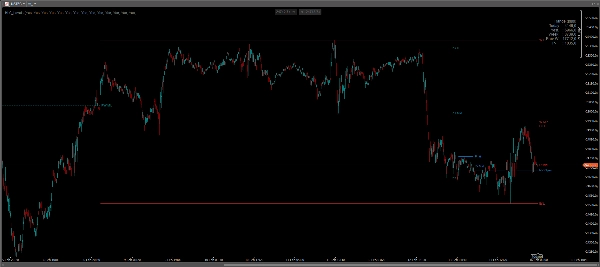
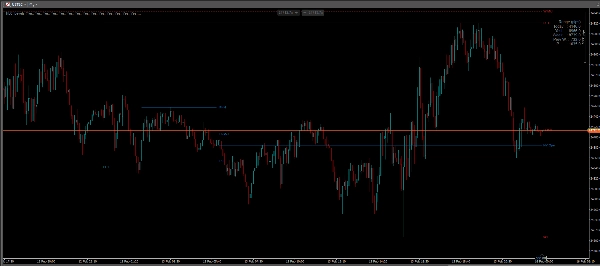
- Level Harian: Menampilkan secara otomatis Level Tertinggi, Terendah, dan Tengah (50%) Hari Ini dan Kemarin.
- Level Mingguan: Memvisualisasikan Level Tertinggi, Terendah, dan Tengah Minggu Saat Ini dan Minggu Sebelumnya.
- Pembukaan Tengah Malam NY: Tombol khusus untuk level harga institusional New York pukul 00:00 (Pembukaan Hari Sebenarnya), penting untuk bias arah.
- Rentang / Sesi Kustom: Tentukan jendela waktu Anda sendiri (misalnya, Sesi Asia, Pembukaan London, atau Initial Balance). Indikator akan menggambar Level Tertinggi, Terendah, dan Tengah untuk periode tersebut.
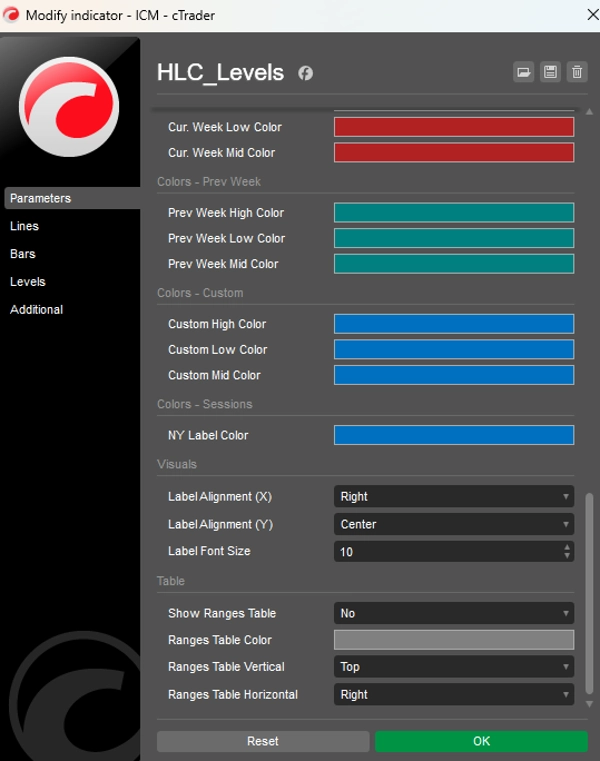
- Dasbor Volatilitas: Tabel di grafik yang menunjukkan rentang pip (Tertinggi dikurangi Terendah) untuk Hari, Kemarin, Minggu, Minggu Sebelumnya, dan Rentang Kustom Anda.
- Intelijen Zona Waktu: Bekerja dengan waktu Broker, UTC, NY, atau waktu Lokal untuk memastikan level sesuai dengan strategi Anda.
Mengapa menggunakan indikator ini?
- Titik Reaksi: Level Tertinggi/Rendah Lama dan Titik Tengah sering bertindak sebagai support dan resistance yang kuat.
- Tengah (Keseimbangan): Level 50% adalah kunci untuk mengidentifikasi harga "Diskon" vs "Premium".
- Sepenuhnya Dapat Disesuaikan: Aktifkan/nonaktifkan garis apa pun. Ubah warna, gaya garis, dan posisi label agar sesuai dengan template Anda.
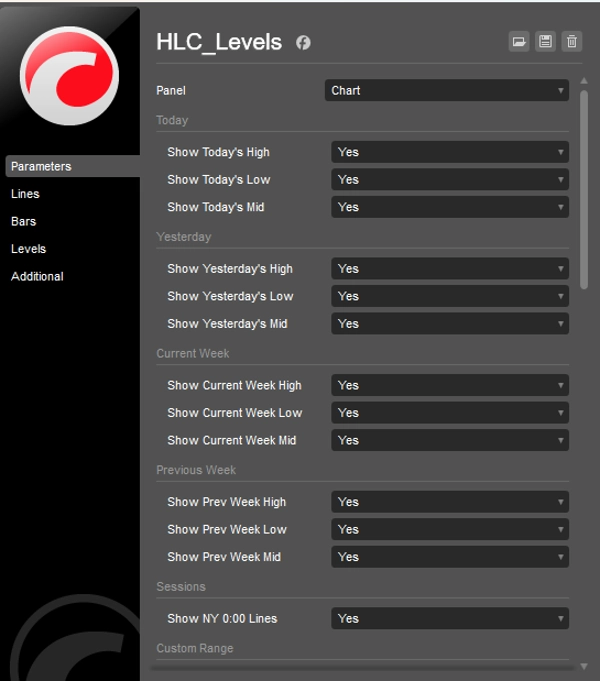
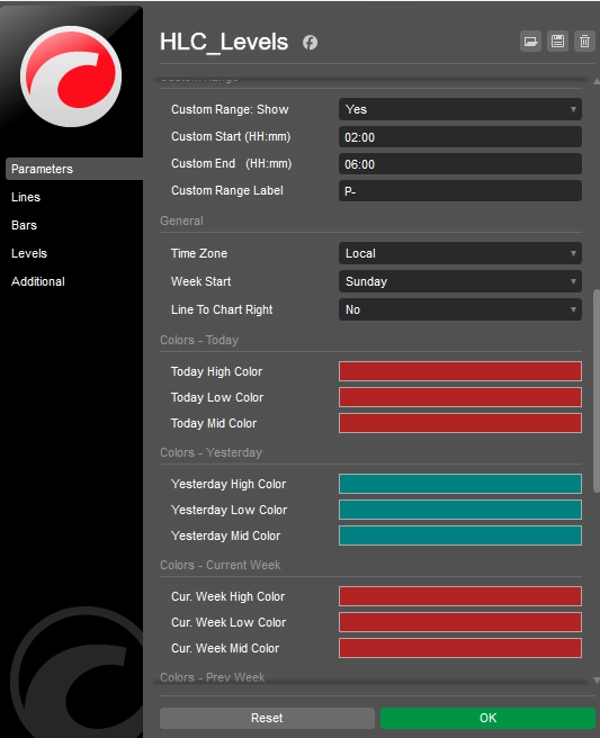
Pengaturan:
- Aktifkan/Nonaktifkan kerangka waktu tertentu (Hari Ini, Kemarin, Minggu, Minggu Sebelumnya).
- Waktu Mulai/Akhir Kustom untuk rentang sesi tertentu.
- Opsi "Perpanjang Garis" untuk memproyeksikan level ke masa depan.
- Warna kustom untuk setiap grup garis.
Ringkasan
Profil indikator
Ulasan pelanggan
4.3
Ulasan: 3
5 | 33 % | |
4 | 67 % | |
3 | 0 % | |
2 | 0 % | |
1 | 0 % |
Ulasan pelanggan
May 16, 2026
Bit weird to see there is no Close level eventhough it's called HLC_levels.. There is a high and low and a mid, but no close. I kinda find it essential to have a close though. Other than that is safes me huge amount of time daily to not set all these levels manually. So besides the lack of the close level i still like this indicator. Would love to see a new version with the added close level as the name suggests
March 2, 2026
A 5 minute check should not become a 30 minute rabbit hole, and the entry needs one more reason to make sense.
February 21, 2026
most of the value comes from the decision gets a little more breathing room. The market context still matters.
Diskusi
Pertanyaan umum
Prop
Forex
Scalping
Indices
SMC
AI
XAUUSD
NAS100
USDJPY
Produk-produk yang tersedia melalui cTrader Store, termasuk bot trading, indikator, dan plugin, disediakan oleh pengembang pihak ketiga serta hanya ditujukan untuk akses teknis dan informasi. cTrader Store bukan broker dan tidak menyediakan saran investasi, rekomendasi pribadi, atau jaminan apa pun tentang kinerja di masa mendatang.


Harga
24
Penjualan
662
Instal gratis