
RSI Advanced
Indikator
1 pembelian
Versi 1.0, Apr 2026
Windows, Mac
5.0
Ulasan: 1

Deskripsi
Indeks Kekuatan Relatif (RSI) standar adalah salah satu indikator paling populer di dunia, tetapi menggambar satu garis di bagian bawah grafik Anda adalah cara perdagangan yang sudah usang. Ini membuat sulit untuk melihat pergeseran momentum sejati, percepatan, dan pasar yang bergejolak.
The RSI Advanced sepenuhnya mengubah osilator klasik ini. Dengan memperkenalkan Garis Sinyal, Penyaringan Volatilitas, dan Pengecatan Grafik Pintar, ini mengubah RSI menjadi dasbor momentum dan pengikut tren yang komprehensif dan serba guna.
Fitur Utama
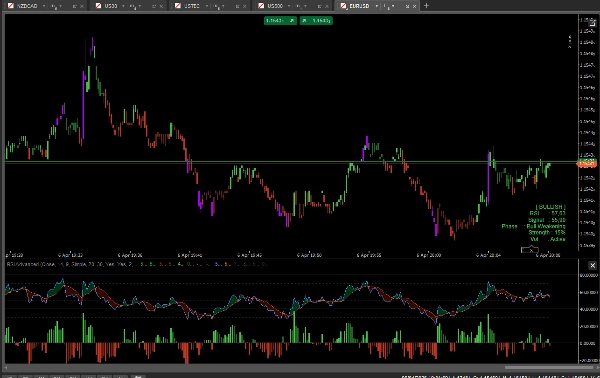
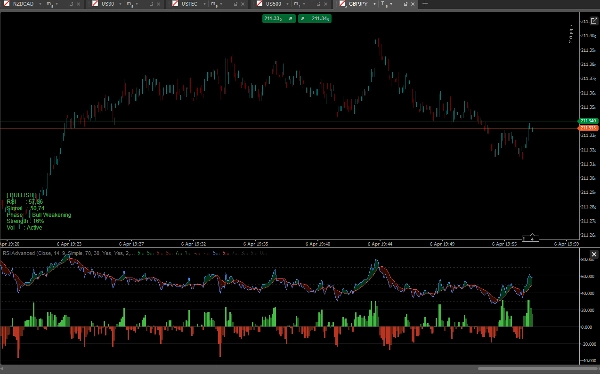
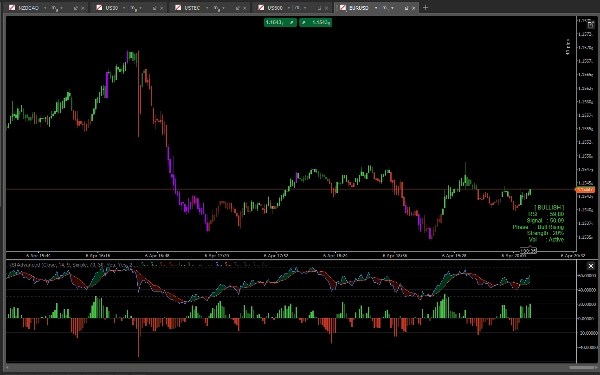
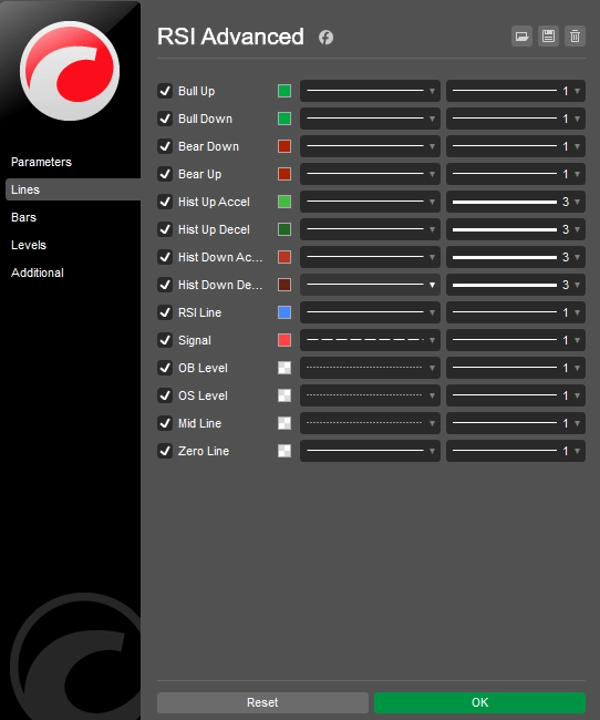
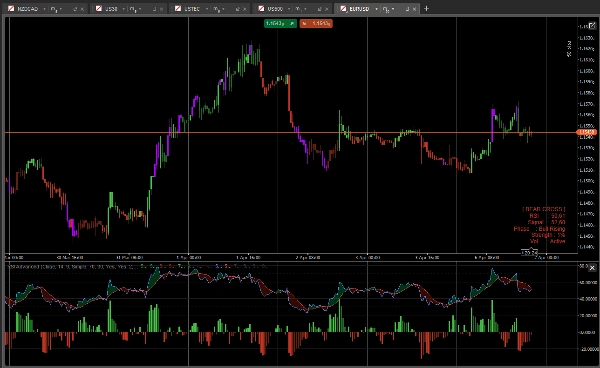
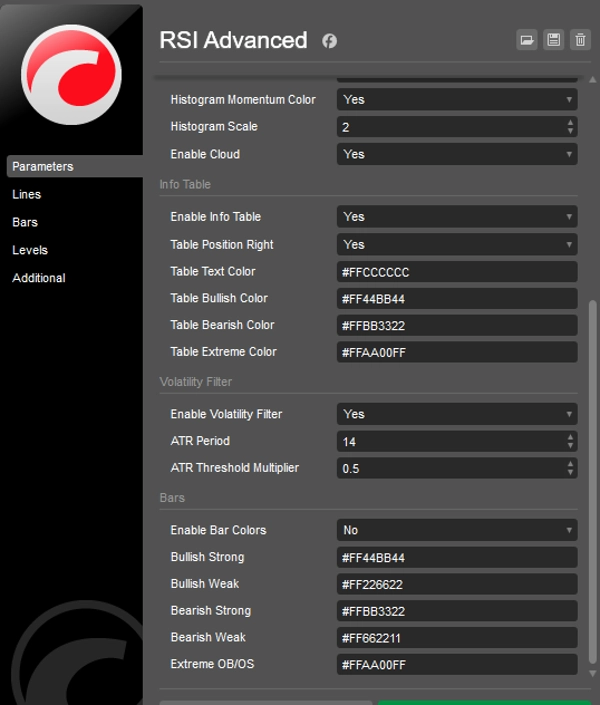
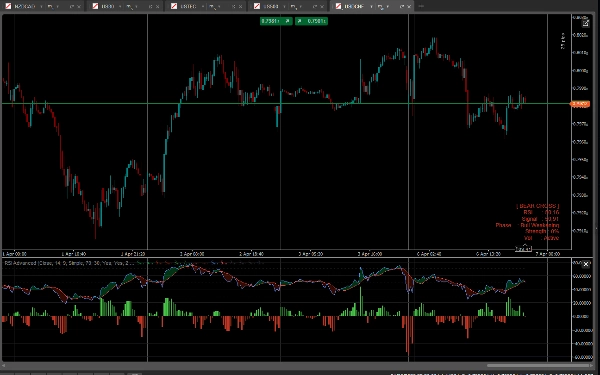
- RSI & Awan Sinyal: Kami menambahkan Rata-Rata Bergerak (Garis Sinyal) ke RSI. Ruang antara RSI dan Garis Sinya diisi dengan Awan dinamis. Jika awan berwarna Hijau, Bulls mengendalikan momentum. Jika berwarna Merah, Bears yang menguasai.
- Histogram Momentum: Histogram yang terpusat melacak jarak tepat antara RSI dan Garis Sinyal. Dengan warna percepatan/perlambatan bawaan (terang vs. gelap), Anda dapat mengantisipasi persilangan dan kelelahan momentum sebelum terjadi.
- Pewarnaan Batang Pintar (Paintbars): Lilin Anda akan berubah warna berdasarkan momentum RSI yang mendasarinya:
-
- Hijau/Merah Terang: Penyelarasan bullish/bearish yang kuat (RSI > 50 dan RSI > Sinyal).
- Hijau/Merah Gelap: Momentum lemah atau penarikan kembali.
- Ungu/Magenta: Level Jenuh Beli (OB) atau Jenuh Jual (OS) Ekstrem – memperingatkan Anda tentang potensi pembalikan.
- Filter Volatilitas Pintar (ATR): Bosan terpotong-potong di pasar datar? Aktifkan filter ATR bawaan. Ketika volatilitas turun di bawah rata-rata historis Anda, lilin dan histogram berubah abu-abu, menjaga Anda dari perdagangan yang buruk.
- Dasbor Info di Grafik: Panel data yang ramping menampilkan metrik waktu nyata: nilai RSI dan Sinyal yang tepat, Fase Momentum, persentase Kekuatan Tren, dan Status Volatilitas.
- Sepenuhnya Tidak Terkunci: Perdagangkan pada simbol APA PUN (Forex, Crypto, Indeks, Saham) dan kerangka waktu APA PUN tanpa batasan. Akses seumur hidup.
Bagaimana cara berdagang dengan ini?
- Lanjutan Tren: Cari penarikan kembali di mana RSI tetap di atas Garis Tengah 50, tetapi sedikit turun ke Garis Sinyal. Ketika Histogram mempercepat (hijau terang) dan lilin berubah hijau terang, itu adalah entri lanjutan yang kuat.
- Pembalikan: Ketika lilin berubah Ungu (OB/OS Ekstrem), tunggu RSI melintasi kembali Garis Sinyal (Awan berubah warna) untuk setup pembalikan dengan probabilitas tinggi.
- Menghindari Pasar Bergejolak: Jika Filter Volatilitas mengubah batang Anda menjadi abu-abu, cukup diam dan tunggu pasar bangun.
Ringkasan
Profil indikator
Kategori indikator
Volatilitas
Tipe output
Filter
Persyaratan data
Hanya batang
Sinyal yang didukung
Cross
Kekuatan tren
Volatilitas
Ulasan pelanggan
5.0
Ulasan: 1
5 | 100 % | |
4 | 0 % | |
3 | 0 % | |
2 | 0 % | |
1 | 0 % |
Ulasan pelanggan
April 11, 2026
The first thing that worked was timing feels less random, and a small account test feels safer.
Diskusi
Pertanyaan umum
BTCUSD
Forex
Signal
Indices
EURUSD
Commodities
GBPUSD
NZDUSD
RSI
AI
XAUUSD
NAS100
ATR
USDJPY
Produk-produk yang tersedia melalui cTrader Store, termasuk bot trading, indikator, dan plugin, disediakan oleh pengembang pihak ketiga serta hanya ditujukan untuk akses teknis dan informasi. cTrader Store bukan broker dan tidak menyediakan saran investasi, rekomendasi pribadi, atau jaminan apa pun tentang kinerja di masa mendatang.


Harga
24
Penjualan
662
Instal gratis