

Bollinger Bands Advanced
Wskaźnik
2 zakupy
Wersja 1.0, Apr 2026
Windows, Mac
4.0
Opinie: 3

32
Sprzedaż
991
Bezpłatne instalacje
Opis
Zaawansowany system ściśnięcia i wybicia Bollinger Bands
Wskaźnik Bollinger Bands jest podstawą dla traderów handlujących na zmienności, ale standardowe pasma pomijają istotny kontekst: Czy rynek się ściska? Czy trend jest wystarczająco silny, by na nim jechać? Czy ruch jest przesadzony?
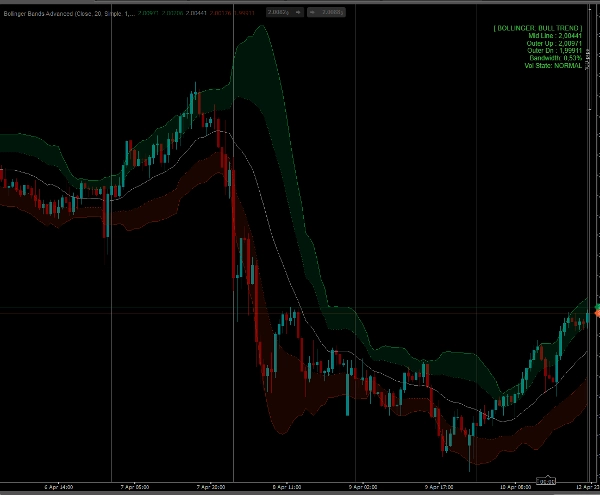
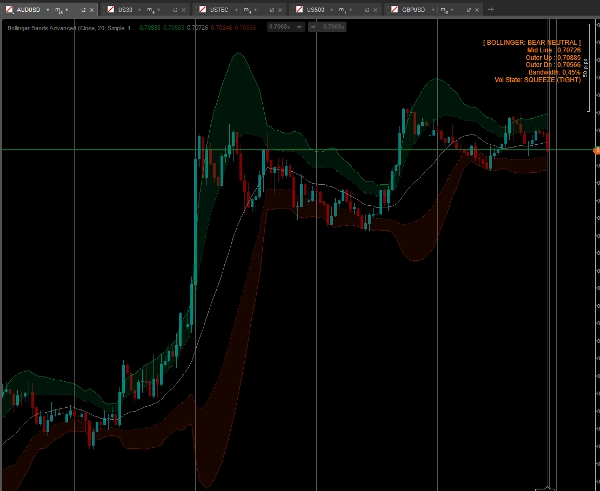
Wskaźnik Bollinger Advanced przekształca standardowe pasma w wysoce wizualny, profesjonalny system handlowy. Poprzez wprowadzenie Stref Podwójnego Działania (Chmury), automatycznego detektora ściśnięcia zmienności oraz inteligentnych słupków kolorystycznych, daje Ci ogromną przewagę w łapaniu wybuchowych wybiciach i idealnym wyczuciu momentu na wejście przy odwróceniu do średniej.
Kluczowe cechy
- System chmur z podwójnym pasmem (Strefy działania): Zamiast pojedynczego zewnętrznego pasma, wskaźnik rysuje Pasmo Wewnętrzne (np. 1 odchylenie standardowe) oraz Pasmo Zewnętrzne (np. 2 odchylenia standardowe). Przestrzeń między nimi jest zacieniona jako Chmura.
-
- Cena wewnątrz Chmury? Jesteś w "Strefie Trendu". Jedź z impetem!
- Cena między linią środkową a Pasmem Wewnętrznym? Jesteś w "Strefie Neutralnej". Czekaj na sygnał.
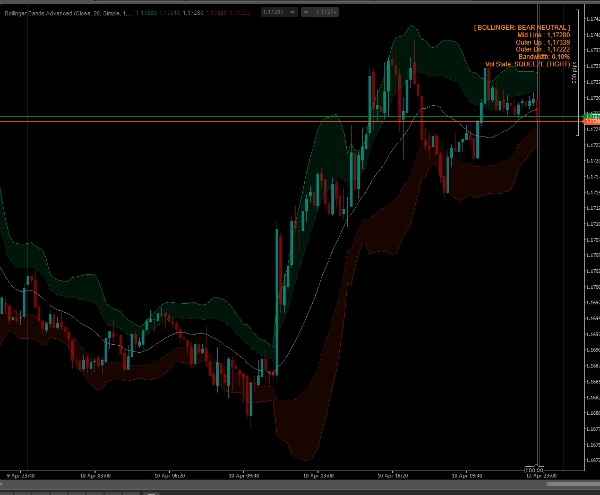
- Automatyczny detektor ściśnięcia: Wskaźnik stale oblicza szerokość pasm Bollingera i porównuje ją z historyczną średnią kroczącą. Na wykresie pojawi się jasnopomarańczowy "SQUEEZE (TIGHT)" alarm, gdy pasma kurczą się nienaturalnie, ostrzegając o nadchodzącym wybuchowym wybiciu!
- Inteligentne kolorowanie słupków (Paintbars): Twoje świece zmieniają kolor w zależności od zmienności i położenia względem pasm:
-
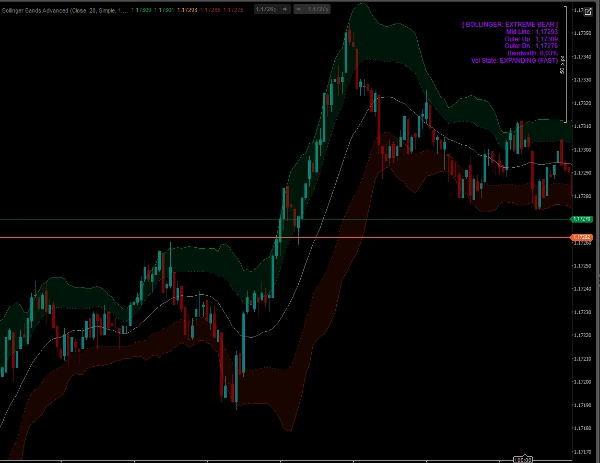
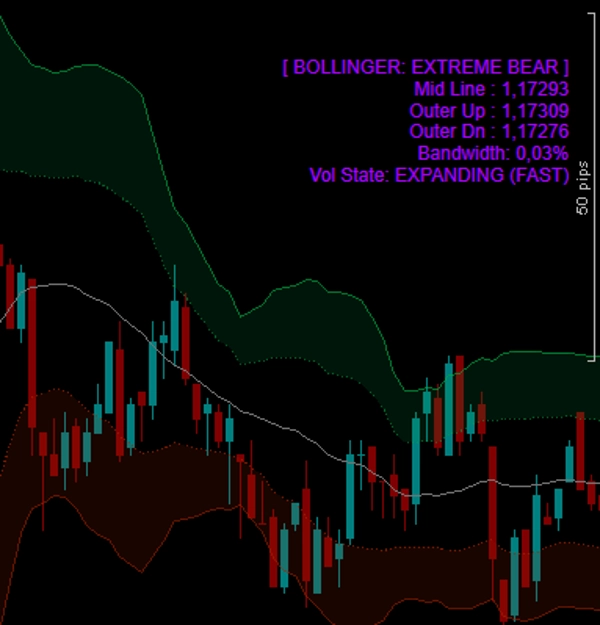
- Neonowy fiolet/magenta (Ekstremalne): Cena zamyka się poza Pasmo Zewnętrznym. To znak ogromnego wybicia lub przesadzonego szczytu.
- Jasnozielony/czerwony (Trend): Cena aktywnie przesuwa się wewnątrz Strefy Działania Chmury.
- Ciemnozielony/czerwony (Neutralny): Cena cofa się w kierunku średniej kroczącej.
- Panel na wykresie w czasie rzeczywistym: Elegancki panel pokazuje dokładne poziomy pasm, aktualny procent szerokości pasm, stan rynku oraz stan zmienności (ściśnięcie, normalny lub rozszerzający się).
- Całkowicie odblokowany: Handluj na DOWOLNYm symbolu (Forex, Crypto, Indeksy, Akcje) i DOWOLnym interwale bez żadnych ograniczeń. Dostęp dożywotni.
Jak handlować z tym wskaźnikiem?
- Wybicie (gra na ściśnięcie): Spójrz na panel. Gdy stan zmienności pokazuje "SQUEEZE", rynek magazynuje energię. Poczekaj, aż świeca przebije się do strefy Chmury i zmieni kolor na jasnozielony/czerwony. To sygnał do wejścia w wybicie o wysokim impetcie.
- Jazda na trendzie: Pozostań w pozycji tak długo, jak świece pozostają jasnozielone/czerwone i przylegają do zewnętrznej Chmury.
- Powrót do średniej: Gdy długi trend wypycha cenę całkowicie poza Pasmo Zewnętrzne (świeca staje się fioletowa) i panel pokazuje "EXPANDING (FAST)", rynek jest zbyt rozciągnięty jak na gumce. Szukaj sygnałów odwrócenia ceny z powrotem do linii środkowej.
Podsumowanie
Podsumowanie AI
Bollinger Bands Advanced is a volatility indicator designed to enhance traditional Bollinger Bands by providing deeper market context for trading decisions. It features a Dual-Band Cloud system that shades the area between an Inner Band (e.g., 1 standard deviation) and an Outer Band (e.g., 2 standard deviations), defining distinct market zones: the Trend Zone (price inside the Cloud) and the Neutral Zone (price between the mid-line and Inner Band).
An automatic Volatility Squeeze Detector monitors Bollinger Bandwidth against historical averages and signals a "SQUEEZE (TIGHT)" alert on an on-chart dashboard when volatility contracts, indicating potential explosive breakouts. Candlesticks are color-coded with Smart Paintbars to reflect volatility and band position: neon purple/magenta for extreme moves outside the Outer Band, bright green/red for active trend momentum inside the Cloud, and dark green/red for neutral pullbacks toward the moving average.
The real-time dashboard displays band levels, bandwidth percentage, market state, and volatility state (Squeezing, Normal, Expanding). The indicator supports all symbols and timeframes across Forex, Crypto, Indices, and Stocks without limitations. Trading strategies include breakout entries during squeezes, trend riding within the Cloud, and mean reversion when price is overextended beyond the Outer Band.
An automatic Volatility Squeeze Detector monitors Bollinger Bandwidth against historical averages and signals a "SQUEEZE (TIGHT)" alert on an on-chart dashboard when volatility contracts, indicating potential explosive breakouts. Candlesticks are color-coded with Smart Paintbars to reflect volatility and band position: neon purple/magenta for extreme moves outside the Outer Band, bright green/red for active trend momentum inside the Cloud, and dark green/red for neutral pullbacks toward the moving average.
The real-time dashboard displays band levels, bandwidth percentage, market state, and volatility state (Squeezing, Normal, Expanding). The indicator supports all symbols and timeframes across Forex, Crypto, Indices, and Stocks without limitations. Trading strategies include breakout entries during squeezes, trend riding within the Cloud, and mean reversion when price is overextended beyond the Outer Band.
Profil wskaźnika
Kategoria wskaźnika
Zmienność
Typ wyjścia
Sygnały
Wizualizacja
Filtr
Wymagania dotyczące danych
Tylko słupki
Obsługiwane sygnały
Przełamanie
Siła trendu
Zmienność
Dyskusja
Opinie klientów
4.0
Opinie: 3
5 | 0 % | |
4 | 100 % | |
3 | 0 % | |
2 | 0 % | |
1 | 0 % |
Opinie klientów
April 20, 2026
demo first, then maybe small size if the notes look sane. The setup needs patience.
April 18, 2026
April 13, 2026
Częste pytania
Bollinger Bands
Channel
ATR
Produkty dostępne za pośrednictwem cTrader Store, w tym boty handlowe, wskaźniki i wtyczki, dostarczane są przez deweloperów zewnętrznych i udostępniane wyłącznie w celach informacyjnych oraz w celu zapewnienia dostępu technicznego. cTrader Store nie jest brokerem i nie zapewnia doradztwa inwestycyjnego, nie udziela spersonalizowanych rekomendacji ani nie gwarantuje przyszłych wyników.
















![Logo „[Stellar Strategies] Market Session Ultimate”](https://cdn.ctrader.com/image/webp/61ffd537-0125-4246-9e72-42eca1791d64_28232)













Cena
32
Sprzedaż
991
Bezpłatne instalacje