
✅ Раскрывает скрытые зоны ликвидности до реакции цены
✅ Визуализирует накопление покупателей и продавцов с градиентными уровнями интенсивности
✅ Выделяет ключевые точки разворота с высоким воздействием в реальном времени
✅ Показывает, где институции поглощают или распределяют
✅ Идеально подходит для входов, выходов и целей на основе ликвидности
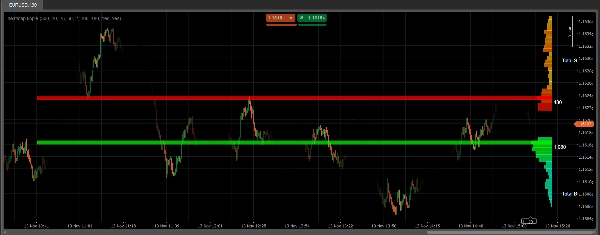
Тепловая карта ликвидности показывает, где объем тихо накапливается под поверхностью.
Зоны с градиентной окраской показывают глубину, силу и намерения покупателей и продавцов в реальном времени.
Чем ярче зона, тем больше ликвидность — и выше вероятность реакции.
Эти области часто выступают как магниты, зоны отторжения или уровни взрывного прорыва.
Вместо угадывания поддержки и сопротивления вы торгуете реальным интересом рынка.
Тепловая карта добавляет непревзойденную ясность в движение цены и структуру рынка.
Идеально подходит для скальперов и внутридневных трейдеров, которые хотят ранние сигналы, а не поздние подтверждения.
Наблюдайте формирование ликвидности. Предвидьте движение. Торгуйте с уверенностью.
5 | 0 % | |
4 | 100 % | |
3 | 0 % | |
2 | 0 % | |
1 | 0 % |


