Superior Trading Sessions Indicator cTrader
指标
1 购买
版本 1.0, Jun 2026
Windows 版、Mac 版
说明
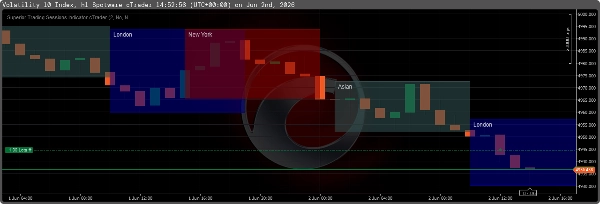
Superior Trading Sessions 指标是一个纯技术绘图工具,专为 cTrader 原生构建。它自动计算并可视化主要的全球交易时段(亚洲、伦敦、纽约、法兰克福),同时结合结构性的智能资金概念(SMC)元素。设计目的是追踪流动性池和结构性目标,而不会干扰价格行为。
核心可视化
- 交易时段矩形: 绘制4个主要交易时段和4个特定高波动“杀戮区”,具有可调透明度和清晰的实线边框。
- 前一日高/低(PDH/PDL): 自动绘制昨日的最高价和最低价,作为当前实时交易日的结构性流动性目标。
- 亚洲区间投射: 从亚洲高点和低点向前延伸16小时的水平线,帮助识别伦敦和纽约重叠期间的流动性扫荡。
- 交易时段均衡: 在活跃时段中绘制50%的中线(均衡线),客观确定溢价与折价的定价区域。
- 实时数据: 显示活跃时段的实时点数大小,并在时段框的角落显示精确的高/低价标签。
- 减少杂乱: 包含一个选项,可完全隐藏所有历史时段框,仅保留图表上当前运行的时段。
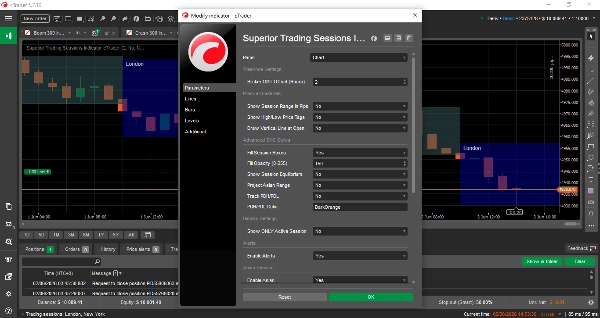
输入参数说明
时区设置
- 经纪商 GMT 偏移: (整数) 设置为您的经纪商的 UTC/GMT 偏移。这确保标准交易时段时间与经纪商服务器时间完全对齐。
高级功能
- 显示时段点数范围: (真/假) 在时段名称标签旁显示该时段的总点数高度。
- 显示高/低价标签: (真/假) 在时段框的右上角和右下角显示精确的价格水平。
- 在开盘处绘制垂直线: (真/假) 在时段的开盘蜡烛上精确绘制一条垂直虚线。
高级 SMC 样式
- 填充时段框: (真/假) 若为真,矩形有阴影背景。若为假,矩形为空心(仅绘制边框框架)。
- 填充不透明度 (0-255): 控制时段填充的透明度。较低值(例如80)保持蜡烛图可见;较高值则创建更暗、更丰富的背景。
- 显示时段均衡线: (真/假) 在时段的50%回撤水平处绘制虚线。
- 投射亚洲区间: (真/假) 从亚洲高点和低点投射水平趋势线至当天剩余时间。
- 追踪 PDH/PDL: (真/假) 绘制标记前一日极端高低点的实线水平线。
- PDH/PDL 颜色: 定义用于每日流动性线的颜色。
显示设置
- 仅显示活跃时段: (真/假) 若为真,指标删除所有历史绘图,仅渲染当前进行的时段。
提醒与通知
- 启用提醒: (真/假) 在新时段开始的那一秒播放 cTrader 原生门铃声音。
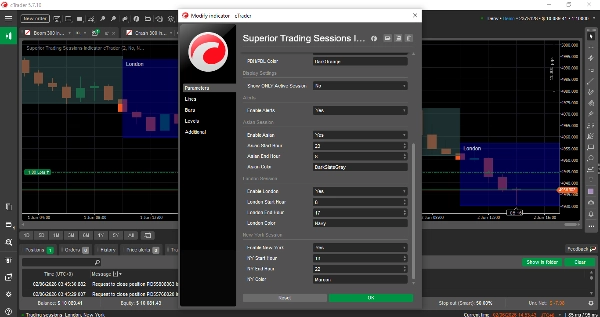
时段时间设置
- 启用 [时段]: 切换主要时段的可见性。
- [时段] 开始/结束时间: 主要时段的 GMT 开始和结束时间。
- [时段] 颜色: 应用于该时段框、文本和线条的特定颜色。
摘要
AI 摘要
The Superior Trading Sessions Indicator for cTrader is a technical charting tool that automatically maps major global trading sessions—Asian, London, New York, and Frankfurt—directly on your charts. It highlights key market periods known as "Killzones" with adjustable transparency and clear borders. The indicator plots previous day’s high and low prices as structural liquidity targets and extends Asian session range lines forward to assist in identifying liquidity sweeps during overlapping sessions.
It includes a session equilibrium line marking the 50% midpoint to help distinguish premium versus discount price zones. Real-time session pip ranges and exact high/low price labels are displayed for active sessions. Users can reduce chart clutter by showing only the current session’s data.
Configurable input parameters allow adjustment of broker GMT offset, session start/end times, colors, and display options such as filled or hollow session boxes, vertical lines at session open, and alert sounds at session start. Advanced Smart Money Concepts (SMC) features support tracking of liquidity pools and structural levels including previous day highs/lows and Asian range projections.
This indicator is designed to provide clear, structured visualization of key trading sessions and liquidity targets without obscuring price action, aiding traders in market timing and structural analysis.
指标配置
指标分类
市场结构(SMC)
输出类型
可视化
数据要求
跳动点数据
仅 K 线
支持的信号
时段开盘区间
客户评价
0.0
评价:0
客户评价
该产品尚无评价。已经试过了?抢先告诉其他人!
讨论
常见问答
Fibonacci
Premium/Discount
Key Levels
BOS
Liquidity Sweep
Support & Resistance
cTrader Store 提供的所有产品,包括交易机器人、指标和插件,均由第三方开发者提供,仅供信息参考和技术访问之用。cTrader Store 并非经纪商,不提供投资建议、个人推荐或任何未来业绩保证。