
Beschreibung
Einführung des anpassbaren klassischen MACD Indikators, der entwickelt wurde, um Ihr Handelserlebnis mit personalisierten Funktionen zu verbessern.
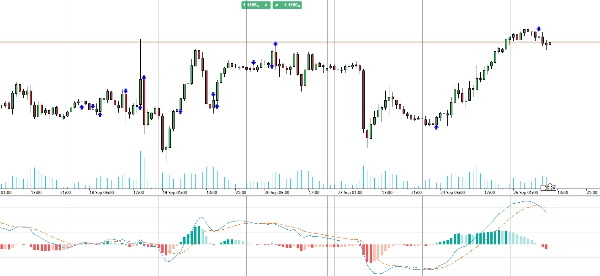
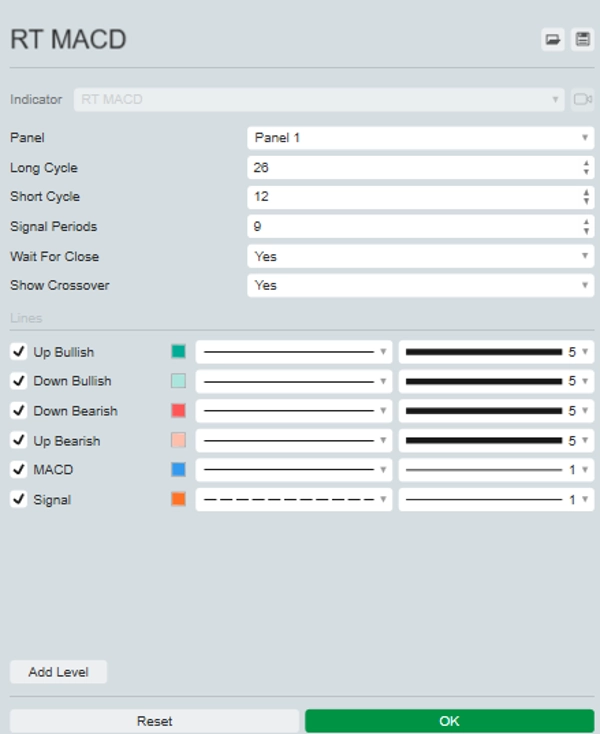
Diese verbesserte Version des traditionellen MACD ermöglicht es Ihnen, die Farben der Linien und des Histogramms für eine klarere Chartvisualisierung anzupassen. Optional kann er in Echtzeit mit Tick-Daten anstelle des Kerzenschlusses aktualisiert werden, um zeitnahe Einblicke in schnelllebigen Märkten zu bieten.
Zusätzlich hebt er Kreuzungspunkte direkt im Chart hervor, was das Erkennen potenzieller Kauf- und Verkaufssignale erleichtert.
Verbessern Sie Ihre Handelsstrategie mit dem anpassbaren klassischen MACD Indikator für verbesserte Genauigkeit und Entscheidungsfindung.
Zusammenfassung
Indikatorprofil
Kundenbewertungen
0.0
Bewertungen: 0
Kundenbewertungen
Bisher gibt es keine Bewertungen für dieses Produkt. Haben Sie es schon ausprobiert? Dann können Sie die erste Person sein, die andere darüber informiert!
Diskussion
Häufig gestellte Fragen (FAQ)
BTCUSD
Forex
Signal
Indices
EURUSD
Commodities
GBPUSD
NZDUSD
Prop
Scalping
Crypto
Stocks
XAUUSD
NAS100
MACD
USDJPY
Über den cTrader Store verfügbare Produkte, einschließlich Handelsbots, Indikatoren und Plugins, werden von externen Entwicklern bereitgestellt und nur zu Informations- und technischen Zugriffszwecken verfügbar gemacht. cTrader Store ist kein Broker und erbringt keine Anlageberatung, persönlichen Empfehlungen oder eine Garantie für zukünftige Performance.


Preis
Seit 25/09/2024
20
Verkäufe