
Market_Session_Forex
Indikator
4 pembelian
Versi 1.0, Jul 2025
Windows, Mac
4.5
Ulasan: 2
Penerangan
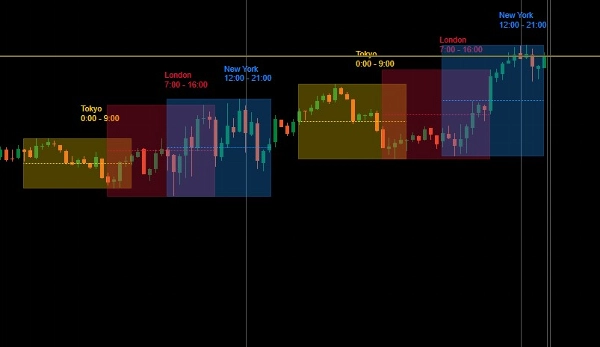
Pasaran Forex beroperasi 24 jam sehari melalui sesi dagangan global yang bertindih. Setiap sesi mencerminkan aktiviti pusat kewangan utama dan dicirikan oleh tahap kecairan, volatiliti, dan jumlah dagangan yang berbeza-beza.
📊 Carta menunjukkan tiga sesi utama dalam blok masa yang diselaraskan:
🟡 Sesi Tokyo (Sesi Asia)
🔴 Sesi London (Sesi Eropah)
🔵 Sesi New York (Sesi A.S.)
🧩 Tempoh Bertindih:
- Bertindih London–New York
Tempoh paling aktif dalam hari dagangan dengan jumlah puncak dan pergerakan harga utama.
Produk Lain Saya
- Zon FVG Institusi MTF dengan Konfluens
- Suite Tahap Sesi Serba Ada
- MARKET_STRUCTURE BOS_CHoCH
- Lapisan Carta Candlestick Multi_TF
- ICT Killzones & Makro
- ICT_SMC_ToolKit
- VWAP_MTF
- Indeks Dinamik Pedagang (TDI)
- Market_Session_Forex
Ringkasan
Profil indikator
Ulasan pelanggan
4.5
Ulasan: 2
5 | 50 % | |
4 | 50 % | |
3 | 0 % | |
2 | 0 % | |
1 | 0 % |
Ulasan pelanggan
August 7, 2025
July 31, 2025
ngl, weak ideas are easier to skip and that is enough to keep testing it. It is one check, not the full trade.
Perbincangan
Soalan Lazim
Produk yang tersedia melalui cTrader Store, termasuk bot dagangan, indikator dan plugin, disediakan oleh pembangun pihak ketiga dan diberikan akses untuk tujuan maklumat dan teknikal sahaja. cTrader Store bukan broker dan tidak memberikan nasihat pelaburan, syor peribadi atau sebarang jaminan prestasi masa hadapan.


![Logo "[Stellar Strategies] Inside Bar with Signals"](https://cdn.ctrader.com/image/webp/1d9e8bfa-3b2c-4440-bb37-5856902008a7_30683)


Harga
Sejak 22/06/2025
71
Jualan
63
Pemasangan percuma