
Descrição
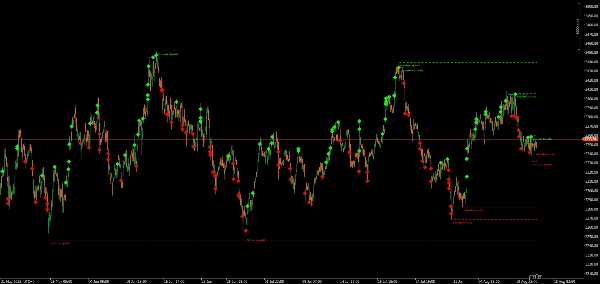
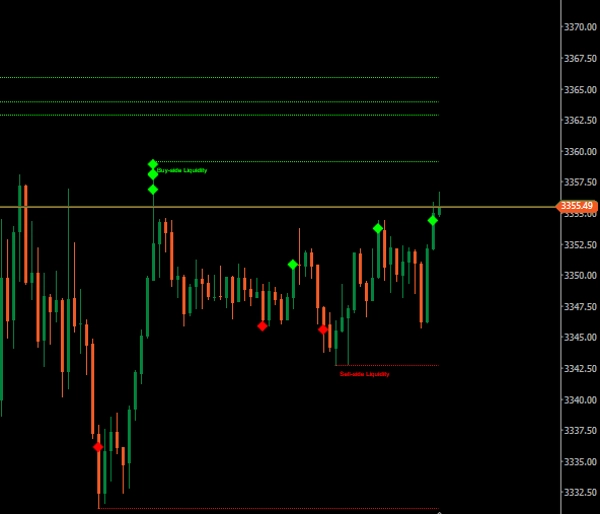
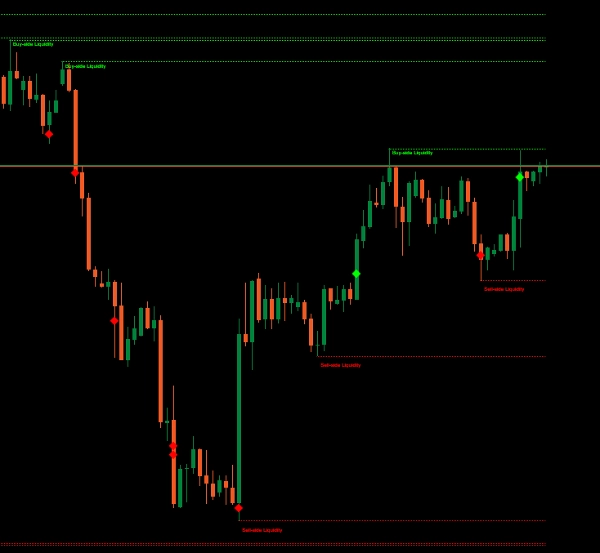
O Indicador de Liquidez Buy-Side & Sell-Side (BSL/SSL) é projetado para traders que seguem estratégias baseadas em (ICT) ou liquidez. Ele detecta automaticamente zonas-chave de liquidez no mercado—destacando os topos oscilantes (Liquidez Buy-Side) e os fundos oscilantes (Liquidez Sell-Side)—e monitora se esses níveis foram varridos ou permanecem intactos.
- BSL (Liquidez Buy-Side) – Marca topos oscilantes recentes onde ordens de stop-loss de posições vendidas ou ordens de compra de rompimento podem estar agrupadas.
- SSL (Liquidez Sell-Side) – Marca fundos oscilantes recentes onde ordens de stop-loss de posições compradas ou ordens de venda de rompimento podem estar posicionadas.
- Marcadores de Varrimento – Quando o preço ultrapassa um nível de liquidez marcado, o indicador plota um marcador em forma de diamante para mostrar o varrimento.
Para Quem É?
- Traders da Metodologia ICT
- Estrategistas de Captura de Liquidez / Caça a Stop
- Scalpers & Day Traders que buscam movimentos baseados em sessões
- Swing Traders procurando pontos de reversão de alta probabilidade
Benefícios
- Clareza visual – Veja instantaneamente onde o mercado provavelmente buscará liquidez.
- Eficiência de tempo – Não é mais necessário marcar manualmente os topos e fundos e verificar varrimentos.
- Vantagem estratégica – Combine com
- FVGs,
- estrutura de mercado para refinar configurações de trade.
- Zonas de eliminação de sessão
- macros
Meus Outros Produtos
- Zonas Institucionais FVG MTF com Confluência
- Suite Completa de Níveis de Sessão
- MARKET_STRUCTURE BOS_CHoCH
- Sobreposição de Gráfico de Velas Multi_TF
- ICT Killzones & Macros
- ICT_SMC_ToolKit
- VWAP_MTF
- Índice Dinâmico de Traders (TDI)
- Market_Session_Forex
Aviso Legal: Negociar envolve riscos, e resultados passados não garantem desempenho futuro. Use gerenciamento de risco adequado, siga os níveis de stop-loss e negocie com responsabilidade. Não me responsabilizo por quaisquer perdas financeiras decorrentes do uso destes algoritmos. Use estes indicadores para sua confluência e reduza o tempo de marcação em seus gráficos.
Resumo
Avaliações de clientes
5 | 33 % | |
4 | 67 % | |
3 | 0 % | |
2 | 0 % | |
1 | 0 % |


![Logótipo de "High-Low Divergence [Iridio Capital]"](https://cdn.ctrader.com/image/webp/443c4661-7abb-40f1-842f-4b6ec560649b_40914)


