
TradingViewMACD
Indicador
3 compras
Versão 1.0, Feb 2025
Windows, Mac
5.0
Avaliações: 1

Descrição
Indicador TradingViewMACD
Eleve sua estratégia de negociação com nosso indicador TradingViewMACD altamente personalizável, projetado para a plataforma cAlgo. Esta ferramenta poderosa combina a flexibilidade e precisão necessárias para otimizar sua análise de mercado.
Principais Características:
- Parâmetros Personalizáveis:
-
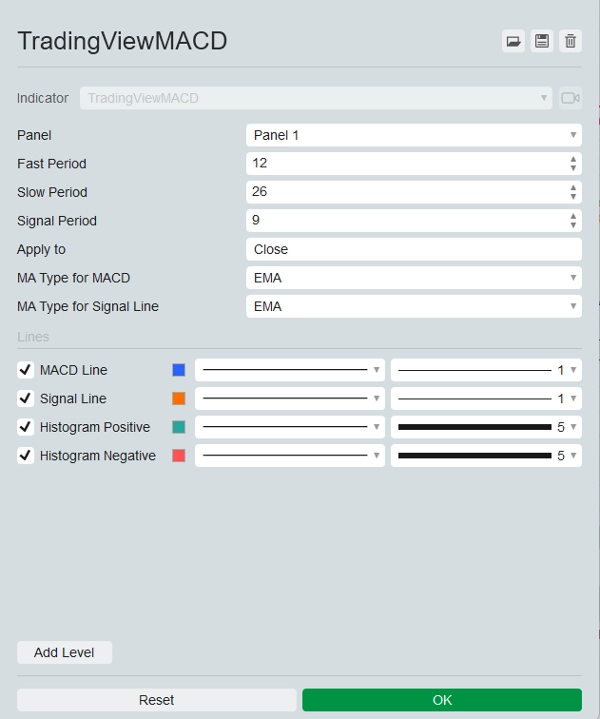
- Período Rápido: Ajuste o período da média móvel rápida para adequar ao seu estilo de negociação.
- Período Lento: Configure o período da média móvel lenta para maior precisão nos sinais.
- Período do Sinal: Defina o período da linha de sinal para ajustar seus pontos de entrada e saída.
- Preço Aplicado: Escolha entre preços de abertura, máxima, mínima, fechamento, mediano, típico ou ponderado para aplicar o indicador.
- Tipos Múltiplos de Médias Móveis:
-
- Selecione entre Média Móvel Simples (SMA) e Média Móvel Exponencial (EMA) tanto para a linha MACD quanto para a linha de sinal, proporcionando flexibilidade na sua análise.
- Saídas Visuais:
-
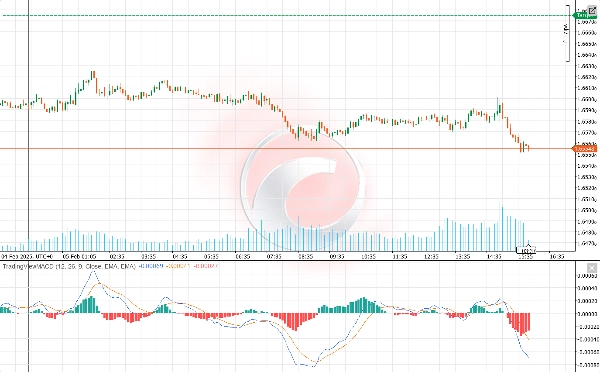
- Linha MACD: Exibida em uma cor azul marcante para clara visibilidade.
- Linha de Sinal: Destacada em laranja vibrante para fácil distinção da linha MACD.
- Histograma: Diferencia valores positivos e negativos com cores verde e vermelha respectivamente, oferecendo uma representação visual clara do momentum do mercado.
- Insights Aprimorados do Mercado:
-
- O indicador calcula a diferença entre as médias móveis rápida e lenta para gerar a linha MACD.
- Calcula a linha de sinal como a média móvel da linha MACD.
- O histograma representa visualmente a diferença entre a linha MACD e a linha de sinal, ajudando a identificar potenciais sinais de compra e venda.
- Fácil de Usar:
-
- Fácil de instalar e configurar, permitindo que traders de todos os níveis se beneficiem de seus recursos avançados.
- Documentação abrangente e suporte ao cliente para garantir uma experiência tranquila.
Liberte todo o potencial da sua estratégia de negociação com o indicador TradingViewMACD. Melhore sua análise de mercado, tome decisões informadas e mantenha-se à frente com esta ferramenta essencial de negociação.
Resumo
Resumo de IA
The TradingViewMACD indicator for the cAlgo platform is a customizable technical analysis tool designed to enhance market analysis. It calculates the difference between fast and slow moving averages to generate the MACD line, computes a signal line as the moving average of the MACD line, and displays a histogram representing the difference between these lines to help identify potential buy and sell signals.
Key features include adjustable parameters such as fast period, slow period, signal period, and applied price (open, high, low, close, median, typical, or weighted). Users can select between Simple Moving Average (SMA) and Exponential Moving Average (EMA) types for both the MACD and signal lines, providing analytical flexibility.
Visual outputs consist of a blue MACD line, an orange signal line, and a histogram with green and red colors indicating positive and negative momentum, respectively. The indicator is designed for ease of installation and configuration, supported by comprehensive documentation and customer support to accommodate traders of all experience levels.
Perfil do indicador
Avaliações de clientes
5.0
Avaliações: 1
5 | 100 % | |
4 | 0 % | |
3 | 0 % | |
2 | 0 % | |
1 | 0 % |
Avaliações de clientes
November 9, 2025
TradingView MACD brings the familiar feel straight to cTrader 🚀 - smooth, light, and 100% accurate to the original. Perfect for traders switching from TV who love clean momentum signals. Missing alerts, but flawless for classic trend and divergence play.
Conversa
Perguntas frequentes
Signal
MACD
Os produtos disponíveis através da cTrader Store, incluindo bots de negociação, indicadores e plugins, são fornecidos por programadores terceiros e são disponibilizados apenas para fins informativos e de acesso técnico. A cTrader Store não é um corretor e não fornece aconselhamento em matéria de investimento, recomendações pessoais ou qualquer garantia de desempenho no futuro.


Preço
Desde 22/11/2024
133
Vendas
2.58K
Instalações gratuitas