
Descrição
Support & Resistance Pro identifica zonas de suporte e resistência e — ao contrário da maioria das ferramentas S/R — mede se essas zonas realmente funcionam, usando um motor estatístico independente baseado em dados históricos reais em vez de suposições. Cada zona mostra uma estatística de taxa de retenção com um intervalo de confiança, calculada a partir da população completa de zonas históricas, incluindo zonas que depois foram rompidas e desapareceram do gráfico. A maioria dos indicadores nesta categoria conta apenas os níveis ainda visíveis hoje, o que inflaciona silenciosamente toda reivindicação de força feita. Este não faz isso.
Principais Recursos
- Zonas Estatisticamente Validadas Cada zona carrega uma taxa de retenção real, medida historicamente, com um intervalo de confiança de 95% — não uma pontuação de força assumida. Um sinal, rejeição do pavio no ponto de contato, foi formalmente validado: confirmado no EURUSD e Bitcoin, em múltiplos períodos de tempo, incluindo um teste genuíno fora da amostra onde o efeito manteve a força em dados não vistos.
- Inversão Automática de Papel Suporte rompido torna-se automaticamente resistência, e vice-versa, com um marcador visual distinto — o indicador rastreia de que lado do preço uma zona está e a colore de acordo, em vez de fixar a cor conforme a formação original da zona.
- Confluência de Período Superior Zonas no seu gráfico são verificadas contra um período superior de sua escolha, com a estrutura HTF correspondente desenhada diretamente no gráfico como uma sobreposição visual separada.
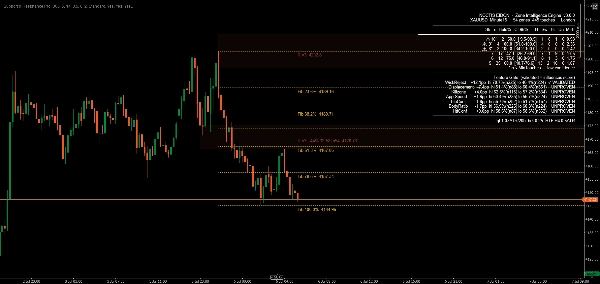
- Integração de Retração de Fibonacci Níveis automáticos de retração de Fibonacci do movimento mais recente, cada um rotulado com a razão e o preço exato na precisão nativa do seu corretor, automaticamente desobstruídos contra zonas próximas para que os rótulos nunca se sobreponham.
- Aviso de Saturação Zonas testadas muitas vezes são sinalizadas em vez de assumidas como mais fortes — nossos dados mostram que zonas muito testadas tendem a performar pior, não melhor, provavelmente porque sua liquidez de repouso já foi consumida.
- Portão Aberto de Validação Seis sinais candidatos adicionais — razão do corpo, velocidade de aproximação, temporização de sessão/killzone e teste de deslocamento — são mostrados ao vivo no painel de estatísticas embutido com suas próprias leituras de taxa de retenção. Eles não influenciam nenhuma pontuação ou classificação até que cada um independentemente ultrapasse a mesma barra de evidência que a rejeição do pavio fez. Você vê exatamente o que está comprovado e o que não está.
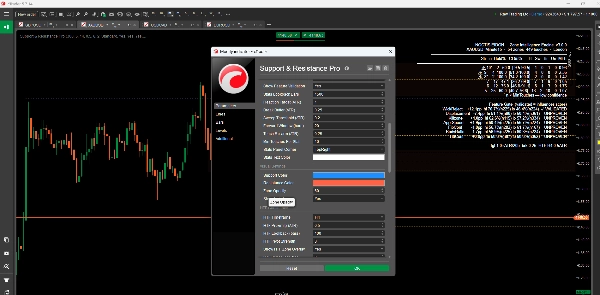
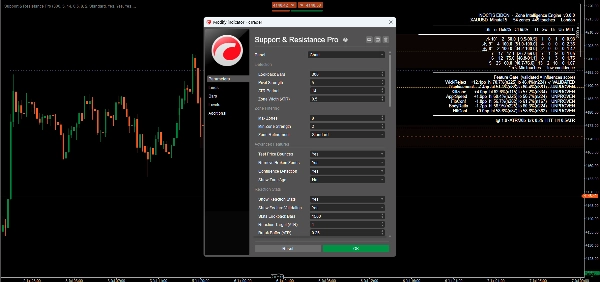
- Configurações Personalizáveis Controle extensivo de parâmetros em sensibilidade de detecção, filtragem de zonas, estilo visual e comportamento de alerta.
- Alertas em Tempo Real Alertas configuráveis de pop-up, e-mail e som para toques em zonas, rompimentos e eventos de confluência, ativáveis independentemente por canal.
Benefícios
- Evidência em vez de suposição: toda estatística no gráfico pode ser verificada independentemente — o indicador inclui suas próprias ferramentas de verificação in-sample/out-of-sample
- Sem viés de sobrevivência: as reivindicações de força são construídas sobre a população histórica completa de zonas, não apenas nos níveis que sobreviveram
- Divulgação honesta: sinais comprovados e não comprovados são rotulados como tais, no gráfico, em todos os momentos
Ideal Para
Traders que querem ver a evidência estatística por trás de um nível, não apenas uma linha — day traders, swing traders e traders sistemáticos em forex, cripto e outros instrumentos buscando uma abordagem rigorosamente medida para suporte e resistência.
Conclusão
Support & Resistance Pro é construído em torno de um princípio: uma reivindicação de força não é real até ser medida. Um sinal ultrapassou essa barreira com confirmação cross-instrumento, cross-timeframe e fora da amostra. O resto é mostrado honestamente como ainda sendo testado — porque um número que você não pode verificar não vale a pena ser mostrado.
Resumo
- Dynamic support and resistance levels that adjust in real-time based on recent price action.
- Multi-timeframe analysis to view levels across different timeframes for a comprehensive market overview.
- Calculation and display of pivot points to mark potential intraday reversal zones and target prices.
- Highlighting of psychological price levels (round numbers) to gauge market sentiment.
- Integration of Fibonacci retracement levels to assist in identifying support and resistance during price corrections.
- Customizable settings for lookback periods, visualization styles, and color schemes to suit individual trading preferences.
- Clear graphical representation for easy identification of market conditions.
- Configurable real-time alerts when prices approach critical levels.
This indicator supports various trading styles including scalping, day trading, and swing trading, and is suitable for traders in forex, commodities, stocks, and indices markets. It is intended for both beginner and experienced traders seeking structured market analysis and enhanced decision-making through reliable support and resistance data.
Avaliações de clientes
5 | 100 % | |
4 | 0 % | |
3 | 0 % | |
2 | 0 % | |
1 | 0 % |


