
Break of Structure
インジケーター
3 購入済
バージョン 1.0、Aug 2025
Windows、Mac
5.0
レビュー: 2
説明
The Break of Structure (BoS CHoCH) Indicator は、トレーダーが簡単に トレンドの継続 と トレンドの反転 をリアルタイムで見つけるのを助けるために設計されたスマートな市場構造ツールです。スイングの高値と安値を自動的に検出することで、このツールは Break of Structure (BoS) と Change of Character (ChoCh) のポイントを特定し、チャート上に視覚的なマーカーで明確かつ実用的な取引シグナルを提供します。
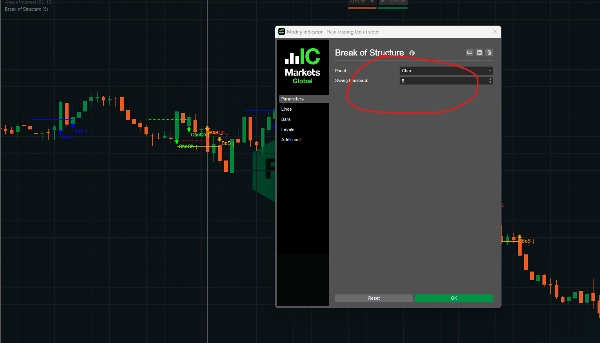
🔎 仕組み
- スイングの高値/安値を検出するために ルックバック期間 を使用します。
- BoS と ChoCh は、現在の価格と以前の構造ポイントを比較して検出されます。
- 価格が以前のLHまたはHLを突破したときに ChoCh が確認され、取引シグナルが発動します。
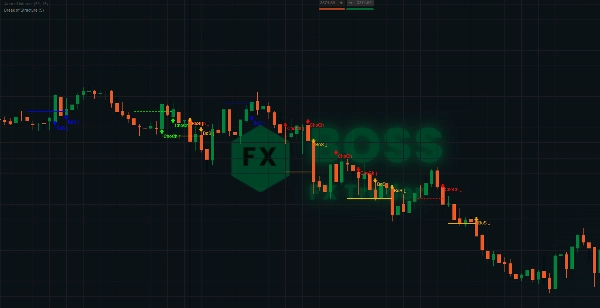
- Break of Structure (BoS): ラベルと矢印で表示されます(トレンド継続)。
- Change of Character (ChoCh): 異なるラベルと矢印で表示されます(トレンド反転)。
- スイングの高値/安値検出は、構造ポイントの追跡と更新 に動的に使用されます。
⚡ インジケーターの特徴
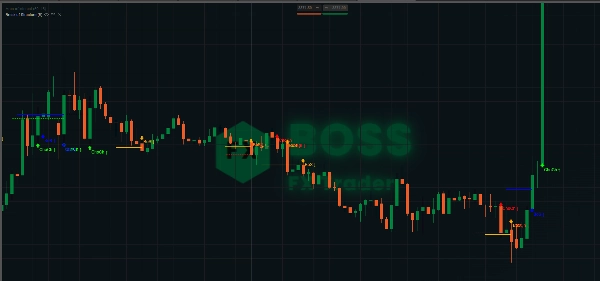
- ✅ BoS検出: 価格が最近の高値(HH)または安値(LL)を突破したときにマークします。
- ✅ ChoCh検出: 価格が低い高値(LH)または高い安値(HL)を突破したときにマークします。
- ✅ 視覚的ラベル&矢印: チャート上に直接プロットされた読みやすいシグナル。
- ✅ トレンド追跡: 市場構造の変化の識別を簡素化します。
The BoS Indicator by BossFXTrader は、トレーダーに価格動向を理解するための 視覚的な優位性 を提供します。継続取引であれ反転取引であれ、このツールは市場構造の重要な瞬間を強調し、自信を持って取引に入る ことができます。
概要
インジケーターのプロフィール
カスタマーレビュー
5.0
レビュー: 2
5 | 100 % | |
4 | 0 % | |
3 | 0 % | |
2 | 0 % | |
1 | 0 % |
カスタマーレビュー
September 5, 2025
September 2, 2025
demo first, then maybe small size if the notes look sane. It should stay in the support stack.
ディスカッション
よくあるご質問
cTrader Storeで入手可能な取引ボット、インジケーター、プラグインなどの商品は、第三者の開発者が提供するものであり、情報と技術の取得のみを目的としてご利用いただけます。cTrader Storeはブローカーではなく、投資助言や個人的な推奨を行うことも、将来のパフォーマンスを保証することもありません。
この作成者の他の商品


価格
登録日 29/05/2025
3.03M
取引数量
45.22K
獲得pips
28
販売
747
無料インストール