
Volume Meter
Indicador
2 compras
Versión 1.0, Sep 2025
Windows, Mac
5.0
Valoraciones: 1
Descripción
📘 Qué Hace Este Indicador
- Muestra volumen de ticks (número de cambios de precio por barra) como un histograma.
- En Forex, los brokers rara vez proporcionan volumen real negociado, por lo que se usa el volumen de ticks como un sustituto.
- En acciones/CFDs/futuros, podrías obtener volumen real.
- Superpone una Media Móvil del volumen (por defecto de 20 períodos).
- Esto actúa como una “línea base” para detectar rápidamente si el volumen de la barra actual es inusualmente alto o bajo.
🎯 Cómo Usarlo como Confirmación
El indicador no es un generador de señales independiente. En cambio, los traders lo usan para confirmar configuraciones de otras estrategias:
- Confirmación de Ruptura
-
- Si el precio rompe por encima de la resistencia o por debajo del soporte, verifica si la vela de ruptura tiene volumen por encima de su MA.
- Un volumen alto confirma que más participantes están detrás del movimiento → la ruptura es más confiable.
- Ruptura con bajo volumen = mayor probabilidad de ruptura falsa.
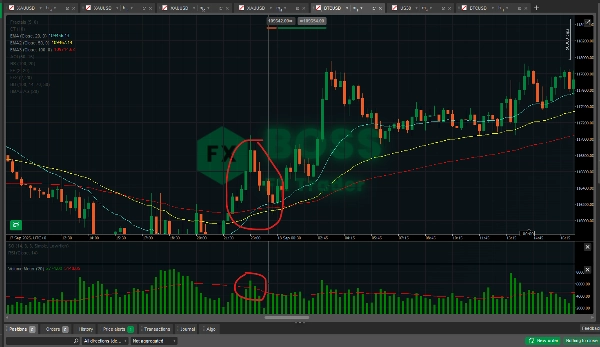
- Continuación vs. Agotamiento de Tendencia
-
- En una tendencia fuerte, las velas de retroceso suelen tener volumen menor en comparación con las velas de impulso.
- Si un retroceso ocurre con bajo volumen y el siguiente movimiento se reanuda con mayor volumen → confirma la continuación de la tendencia.
- Si ves que el empuje de la tendencia continúa pero el volumen disminuye en cada empuje → posible agotamiento, prepárate para una reversión.
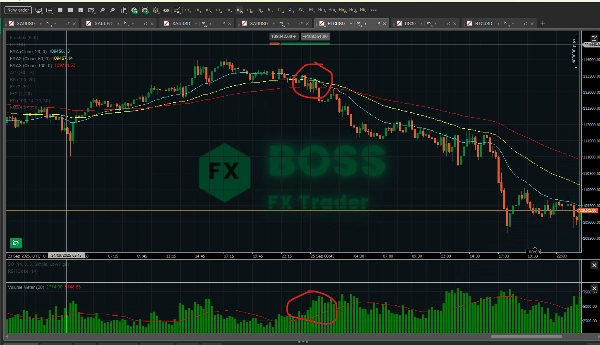
- Confirmación de Reversión
-
- Las grandes velas de reversión (pin bars, velas envolventes, fractales) son más fuertes si están respaldadas por un pico de volumen.
- Ejemplo: pin bar alcista en soporte con alto volumen = señal de reversión más fuerte que el mismo pin bar con bajo volumen.
- Filtro de Señales Falsas
-
- Si tu sistema principal da una señal de compra/venta, pero el volumen es débil (por debajo del promedio), podrías optar por no hacer esa operación.
- Ayuda a reducir el sobretrading y filtrar el ruido.
📊 Efectividad
- En Forex: Se ha demostrado que el volumen de ticks se correlaciona fuertemente con el volumen real negociado (70–90% de correlación en muchos estudios). Por lo tanto, es útil, pero no perfecto.
- En Acciones/Futuros/CFDs: El volumen real hace que esto sea mucho más poderoso ya que mides contratos/acciones realmente negociados.
- Como Confirmación: Se usa mejor con la acción del precio y otros indicadores (por ejemplo, EMA, RSI, fractales). Confiar solo en el volumen es arriesgado.
- Fortalezas: Confirma rupturas, filtra movimientos falsos, detecta agotamiento.
- Debilidades: No predice la dirección por sí solo — solo añade confianza una vez que tienes una configuración.
✅ Consejo práctico:
Usa el indicador como filtro, no como disparador. Por ejemplo:
- Ves un cruce de EMA (señal de compra).
- Verifica: ¿El volumen está por encima de su media móvil? Si sí → realiza la operación. Si no → espera.
De esta manera solo operas cuando el impulso está respaldado por la participación del mercado.
Resumen
Resumen de IA
Volume Meter is a trading indicator that displays tick volume—the number of price changes per bar—as a histogram. In Forex markets, where real traded volume data is often unavailable, tick volume serves as a proxy, while in stocks, CFDs, and futures, real volume data may be used. The indicator overlays a moving average of volume (default 20-period) to provide a baseline, helping traders identify whether current volume is unusually high or low.
This tool is designed to confirm trading setups rather than generate standalone signals. It assists in validating breakouts by checking if breakout candles have volume above their moving average, indicating stronger market participation. It also helps distinguish trend continuation from exhaustion by comparing volume levels during pullbacks and impulse moves. Additionally, it supports reversal confirmation by highlighting volume spikes on significant reversal candles and filters false signals by advising caution when volume is weak despite buy or sell signals from other systems.
Volume Meter is applicable across various markets including Forex, stocks, indices, commodities, and cryptocurrencies. Its effectiveness is enhanced when combined with price action and other indicators such as EMA or RSI. The indicator aids in improving trade decision confidence by integrating volume analysis as a confirmation and filtering tool.
Perfil del indicador
Valoraciones de clientes
5.0
Valoraciones: 1
5 | 100 % | |
4 | 0 % | |
3 | 0 % | |
2 | 0 % | |
1 | 0 % |
Valoraciones de clientes
October 1, 2025
the first 10 trades should stay boring, and the checklist becomes easier to follow.
Conversación
Preguntas frecuentes
BTCUSD
Forex
Breakout
Indices
EURUSD
Commodities
GBPUSD
NZDUSD
Prop
Supertrend
Crypto
Stocks
XAUUSD
NAS100
USDJPY
Los productos disponibles a través de cTrader Store, incluidos bots, indicadores y plugins para operar, son proporcionados por desarrolladores de terceros y están disponibles únicamente con fines informativos y de acceso técnico. cTrader Store no es un bróker, por lo que no proporciona asesoramiento de inversión, recomendaciones personales ni ninguna garantía de rentabilidad futura.


Precio
Desde 29/05/2025
3.04M
Volumen operado
45.22K
Pips ganados
29
Ventas
768
Instalaciones gratis