
Descripción
📊 TrendHeikinMultiMA – Algoritmo Avanzado de Tendencia
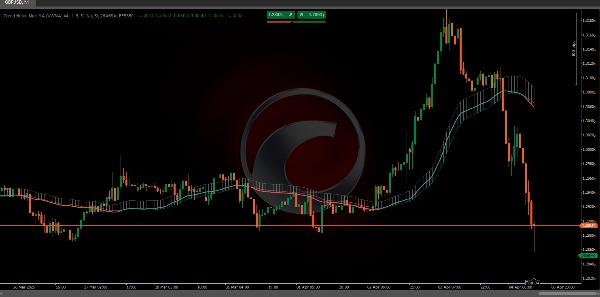
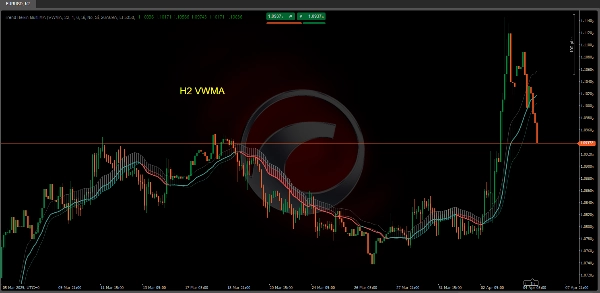
El algoritmo TrendHeikinMultiMA está diseñado para calcular valores de tendencia a partir de datos de precios, utilizando la fórmula Heikin-Ashi para suavizar estos valores y aplicando diferentes tipos de medias móviles (ALMA, HMA, SMA, SWMA, VWMA, WMA, ZLEMA o EMA).
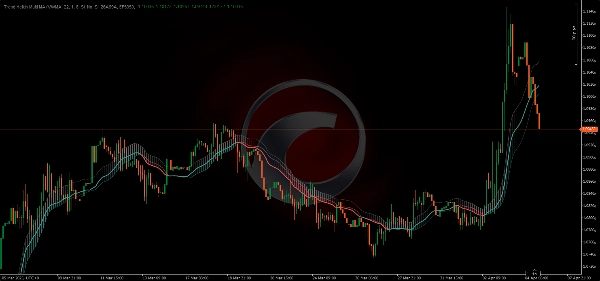
Aunque se utilizan valores Heikin-Ashi internamente, el gráfico no muestra las velas tradicionales de Heikin-Ashi. En cambio, dibuja líneas de tendencia basadas en los valores suavizados, facilitando la interpretación de la dirección del mercado sin la complejidad visual de los gráficos de velas.
🔄 1. El Papel del Suavizado
Dado que los valores de tendencia se derivan del suavizado Heikin-Ashi combinado con una media móvil, el cambio de color en TrendHeikinMultiMA no ocurre inmediatamente cuando el precio cruza la línea de tendencia:
- 🔹 El precio puede moverse temporalmente por encima o por debajo de la línea de tendencia sin provocar un cambio de color.
- 🔹 Esto sucede porque el indicador espera una diferencia significativa y sostenida entre los valores suavizados de apertura y cierre para confirmar una reversión real de la tendencia.
✅ Ventaja en la Interpretación
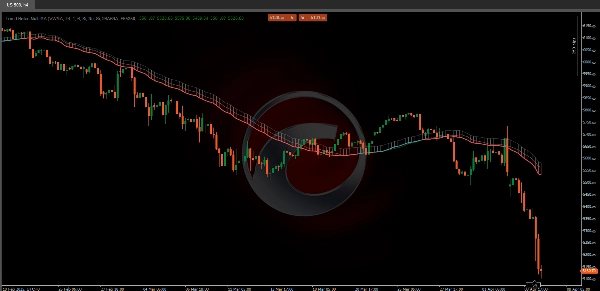
Esta demora intencional en el cambio de color ayuda a evitar señales falsas. En un gráfico de velas tradicional, el precio podría cruzar brevemente la línea de tendencia y activar señales prematuras.
- 🟥 Por ejemplo, incluso si el precio actual está por encima de una línea de tendencia bajista, el indicador permanecerá rojo (bajista) hasta que los valores suavizados confirmen que el cierre es consistentemente mayor que la apertura.
- 🟩 De manera similar, para cambiar a verde (alcista), la media móvil basada en Heikin-Ashi debe confirmar que el cierre supera consistentemente a la apertura.
📈 2. Aplicación de Medias Móviles a Valores Heikin-Ashi
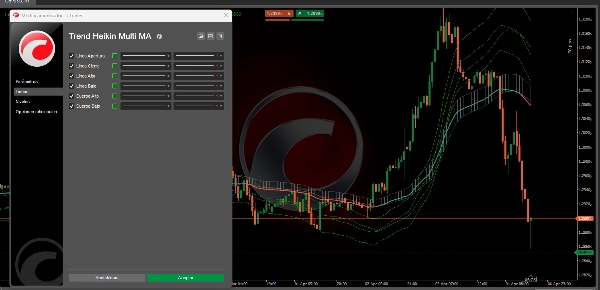
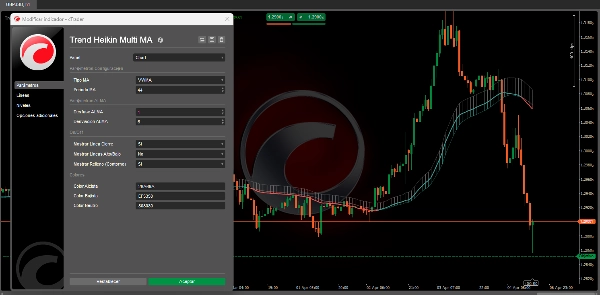
- 🔄 Selección de Media Móvil:
-
- El usuario puede elegir entre diferentes tipos de medias móviles (ALMA, HMA, SMA, SWMA, VWMA, WMA, ZLEMA y EMA).
- Cada tipo de media móvil aplica un método matemático específico para ponderar y suavizar los valores históricos de apertura, cierre, máximo y mínimo derivados de Heikin-Ashi.
🏆 3. Ventajas de Usar TrendHeikinMultiMA vs. Velas Tradicionales
- 📉 Reducción de Ruido:
-
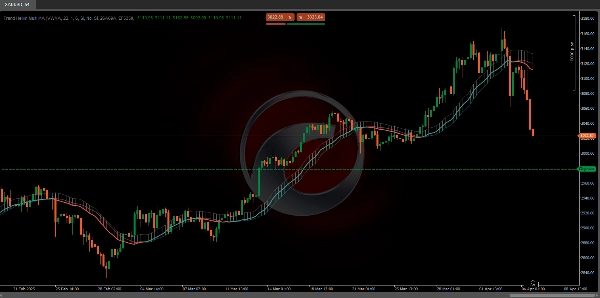
- Las velas tradicionales a menudo muestran alta volatilidad y datos dispersos, dificultando la identificación de la tendencia general.
- TrendHeikinMultiMA suaviza estos datos, filtrando las fluctuaciones menores y eliminando oscilaciones abruptas, permitiendo a los traders centrarse en la dirección principal del mercado.
✅ Conclusión
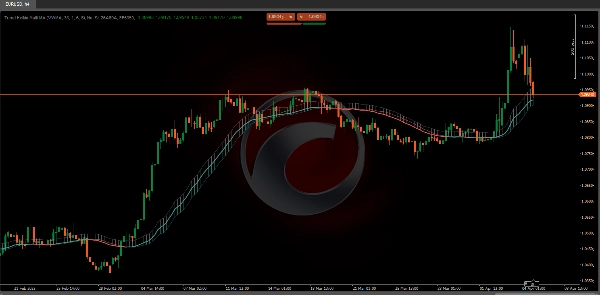
En resumen, TrendHeikinMultiMA confirma un cambio de tendencia (alcista o bajista) solo cuando los valores suavizados de apertura y cierre—calculados a partir de Heikin-Ashi y procesados mediante la media móvil seleccionada—muestran consistentemente que el comportamiento del mercado ha invertido su dirección.
Esto asegura que las señales sean más fiables y menos afectadas por el ruido que se observa en los gráficos de velas tradicionales. 🚀📊
🔥 Indicadores de Pinescritlabs Ctrader Store 🔥
Dynamic Market Structure
Analysis of Turning Points
Fibonacci Linear
Regression Multi-timeframe
Multi-Level Candle Bias
Tracker
Auto Support and
Resistance Trend Lines
All Support and
Resistance Levels
Resumen
The indicator incorporates a smoothing mechanism that delays color changes to confirm trend reversals only after a significant and sustained difference between smoothed open and close values is detected. This approach reduces false signals caused by brief price fluctuations crossing trend lines.
Users can select from multiple moving average types, each applying distinct mathematical weighting methods to the Heikin-Ashi-derived open, close, high, and low values, enhancing customization and adaptability to different trading styles.
Compared to traditional candlestick charts, Trend Heikin Multi MA filters out minor price fluctuations and abrupt swings, allowing traders to focus on primary market trends with more reliable signals. It confirms bullish or bearish trend changes only when smoothed values consistently indicate a market direction reversal, improving signal accuracy and reducing noise.
Valoraciones de clientes
5 | 33 % | |
4 | 67 % | |
3 | 0 % | |
2 | 0 % | |
1 | 0 % |


![Logotipo de "Gaussian Channel [Iridio Capital]"](https://cdn.ctrader.com/image/webp/7c039209-5573-4a54-a072-f9528b503103_41960)


