Descripción
Descripción corta
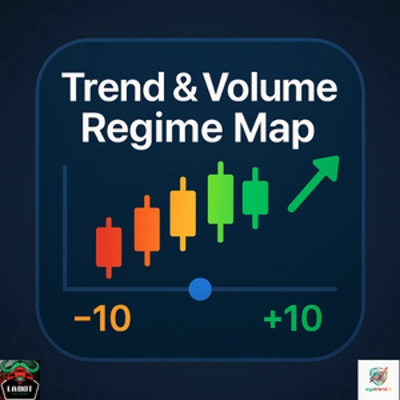
Mapa de Régimen de Tendencia y Volumen es un filtro de régimen para cTrader que mide la dirección y persistencia tanto del precio como del volumen. Te proporciona una puntuación de tendencia normalizada y una puntuación de tendencia de volumen en el rango –10 a +10, colorea tus velas con un degradado suave desde rojo bajista hasta verde alcista, y muestra si el entorno actual es de riesgo, sin riesgo o simplemente ruidoso.
🧠 Qué hace
Este indicador replica la lógica del “Filtro de Régimen” de BigBeluga de TradingView, adaptado para cTrader y envuelto en un claro mapa de régimen de tendencia y volumen.
Precio y volumen suavizados
- Calcula HLC3 (promedio de Alto, Bajo, Cierre) y aplica una Media Móvil Hull (HMA) para suavizar el precio.
- Aplica otra Media Móvil Hull al volumen de ticks.
Puntuación de tendencia (precio)
- Para las últimas N barras (
Length), compara la HMA actual del precio con cada valor pasado de HMA:
- Si HMA actual > HMA pasada → tendencia +1
- Si HMA actual ≤ HMA pasada → tendencia –1
- La puntuación acumulada se escala a –10 … +10 → este es el valor de Tendencia.
Puntuación de tendencia de volumen
- Usa la misma lógica, pero aplicada a la HMA del volumen.
- El resultado es otra puntuación normalizada en –10 … +10 → el valor de Volumen.
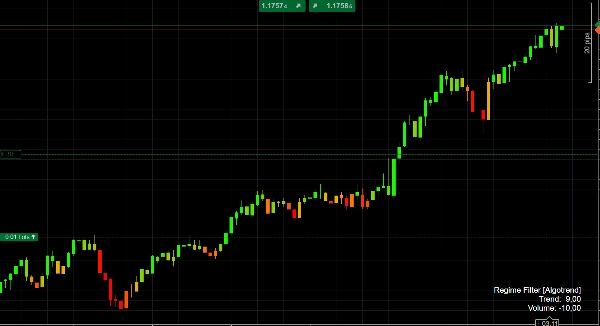
Lógica de color
- Cuando la puntuación de Tendencia es negativa, las velas se colorean con un degradado rojo → naranja dependiendo de cuán fuerte sea el régimen bajista.
- Cuando la puntuación de Tendencia es positiva, las velas se colorean naranja → lima, con verde más fuerte para regímenes alcistas más fuertes.
Esto te da una señal visual instantánea de si la acción del precio es bajista, neutral o alcista, y cuán persistente es ese régimen actualmente.
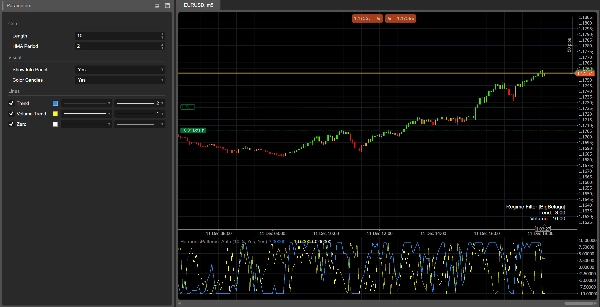
Panel de régimen
En la subventana, el indicador traza:
- Línea de tendencia (azul)
- Línea de tendencia de volumen (gris)
- Línea cero (línea base)
En la última barra imprime un pequeño panel de información con los valores actuales de Tendencia y Volumen.
🎯 Cómo puedes usarlo
Confirmación de tendencia
- Opera solo en la dirección de un régimen fuerte, por ejemplo:
- Tendencia > +4 → sesgo solo alcista
- Tendencia < –4 → sesgo solo bajista
Filtro de régimen
- Apaga o reduce tu estrategia cuando el régimen es débil (Tendencia cerca de 0) o cuando la tendencia de Volumen es fuertemente negativa, lo que a menudo señala movimientos erráticos o en declive.
Contexto para señales
Combina tus señales de entrada existentes (acción del precio, patrones armónicos, osciladores, etc.) con Mapa de Régimen de Tendencia y Volumen como un filtro macro:
- Solo toma rupturas cuando la Tendencia es positiva y la tendencia de Volumen también es positiva.
- Evita configuraciones de reversión a la media cuando la Tendencia es extremadamente fuerte (> +8 o < –8), ya que el mercado está en un régimen direccional poderoso.
⚙️ Parámetros de entrada
Núcleo
Length
Número de barras usadas para construir las puntuaciones de tendencia y volumen.
- Valores más altos → régimen más suave y “macro”; más lento para cambiar pero más estable.
- Valores más bajos → respuesta más rápida, pero más ruido y cambios más frecuentes.
Periodo HMA
Periodo de la Media Móvil Hull usada para suavizar tanto el precio como el volumen.
- Ajústalo para que coincida con tu marco temporal y estilo de trading: más corto para marcos temporales bajos, más largo para marcos temporales altos.
Visual
Mostrar Panel de Información
Muestra/oculta el pequeño panel de texto en la última barra con las puntuaciones actuales de Tendencia y Volumen.Colorear Velas
Permite el coloreado de velas basado en el valor de Tendencia (degradado rojo / naranja / verde). Apágalo si prefieres mantener los colores predeterminados de tu gráfico.
✅ Hoja de trucos para interpretación
- Tendencia ≥ +7 → régimen alcista fuerte, velas verde brillante.
- Tendencia entre +3 y +7 → sesgo alcista; las correcciones son zonas potenciales para comprar en la caída.
- Tendencia entre –3 y +3 → lateral / errático; las señales son menos confiables.
- Tendencia ≤ –7 → régimen bajista fuerte, velas rojo intenso.
- Tendencia de volumen > 0 → actividad creciente / sostenida, los movimientos tienen más probabilidades de ser “reales” y persistentes.
- Tendencia de volumen < 0 → participación en declive, mayor riesgo de movimientos falsos, ruido o reversals.
Resumen
Valoraciones de clientes
5 | 0 % | |
4 | 100 % | |
3 | 0 % | |
2 | 0 % | |
1 | 0 % |


