

present
Regístrese y obtenga 50 $ de descuento en su primera compra
Trading product for Fixed Range Volume profile Indicador Key Levels Imbalance, image 1
Fixed Range Volume profile
Indicador
1 compras
Versión 1.0, Jul 2026
Windows, Mac
Trading product for Fixed Range Volume profile Indicador Key Levels Imbalance, image 2
Trading product for Fixed Range Volume profile Indicador Key Levels Imbalance, image 3
Trading product for Fixed Range Volume profile Indicador Key Levels Imbalance, image 4
Desde 14/01/2025
2
Ventas
143
Instalaciones gratis

Descripción

PERFIL DE VOLUMEN DE RANGO FIJO (FRVP)

Indicador de Perfil de Volumen con Detección Automática


--------------------------------------------------


Distribución de volumen. Áreas de valor. Nodos de alto volumen. Todo desde tu línea de tendencia.


--------------------------------------------------


QUÉ HACE ESTE INDICADOR


El Perfil de Volumen de Rango Fijo (FRVP) muestra la distribución del volumen en un rango definido por el usuario — detectando automáticamente la última línea de tendencia que dibujas en el gráfico.


No se necesita selección manual del rango. Solo dibuja una línea de tendencia y el perfil aparece.


--------------------------------------------------


CARACTERÍSTICAS PRINCIPALES


- DETECCIÓN AUTOMÁTICA de la última línea de tendencia (no se requiere nombrar manualmente)

- Punto de Control (POC) - nivel de volumen más alto

- Área de Valor (VAH + VAL) - porcentaje configurable (70% por defecto)

- Nodos de Alto Volumen (HVN) - volumen por encima del umbral promedio

- Visualización de histograma (lado izquierdo o derecho del rango)

- Filas configurables (de 10 a 200)

- Colores y opacidad personalizables

- Extender líneas hacia la derecha

- Mostrar/ocultar etiquetas de precio

- Sin repintado


--------------------------------------------------


CÓMO FUNCIONA


1. Dibuja una línea de tendencia en el gráfico

2. El indicador la detecta automáticamente

3. Se calcula el perfil de volumen a partir del rango

4. Se muestran POC, VAH, VAL y HVN


No se requiere nombrar. No hay selección manual del rango.


--------------------------------------------------


ELEMENTOS VISUALES


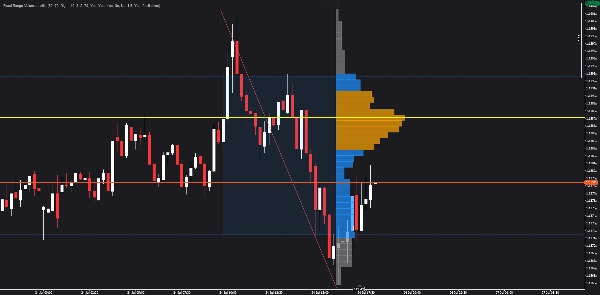
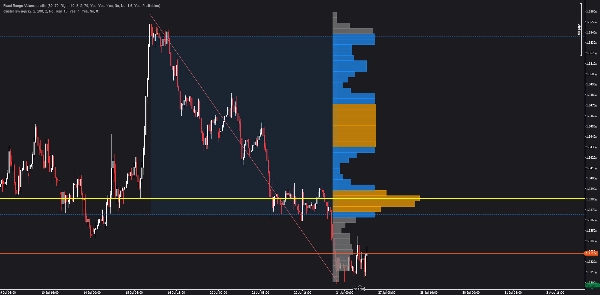
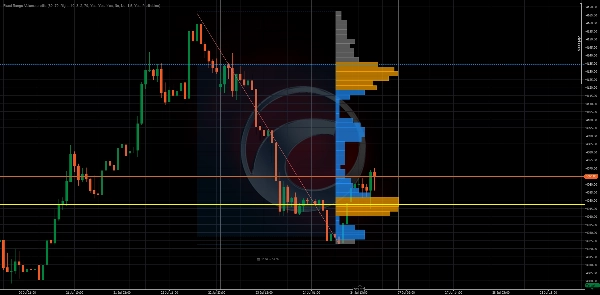
- Línea horizontal amarilla = Punto de Control (POC)

- Líneas azules discontinuas = Valor Alto (VAH) y Valor Bajo (VAL)

- Barras naranjas = Nodos de Alto Volumen (HVN)

- Barras grises = Nodos de bajo volumen

- Región sombreada = Área de Valor (70% del volumen)

- Histograma = Distribución de volumen por nivel de precio


--------------------------------------------------


RESUMEN DE PARÁMETROS


CONFIGURACIÓN DEL PERFIL:

- Número de Filas: Cuántas filas de precio (10-200)

- Porcentaje del Área de Valor: % de volumen en el área de valor (1-100)


CONFIGURACIÓN VISUAL:

- Lado del Perfil: Izquierda o derecha del rango

- Ancho del Histograma %: Ancho de las barras del histograma

- Escala del Ancho de Barra: Factor de escala para el ancho de las barras

- Ancho Mínimo de Barra %: Ancho mínimo de barra

- Opacidad de Barra: Transparencia de las barras (10-100)


COLORES:

- Color del POC

- Color del Área de Valor

- Color del Nodo de Alto Volumen

- Color de Bajo Volumen


NODOS DE ALTO VOLUMEN:

- Umbral HVN: Multiplicador de volumen para calificar como HVN


CONFIGURACIÓN DE LÍNEA DE TENDENCIA:

- Detección Automática de la Última: Encuentra automáticamente la última línea de tendencia

- Nombre Manual de la Línea de Tendencia: Especifica un nombre (si la detección automática está desactivada)


--------------------------------------------------


CASOS DE USO


- Identificar dónde ocurrió la mayor parte del volumen

- Encontrar el Punto de Control (POC) para entradas/salidas

- Usar el Área de Valor (VAH/VAL) para objetivos de ganancia

- Detectar Nodos de Alto Volumen (HVN) para niveles clave

- Entender la distribución del volumen de un vistazo

- Combinar con otros indicadores para confluencia


--------------------------------------------------


ACTUALIZA A ZONAS DE CALOR ESTRUCTURALES


Este indicador te muestra la distribución del volumen.


Zonas de Calor Estructurales va más allá — mapea la intensidad de participación, aceptación vs rechazo y el compromiso del mercado a través de múltiples zonas.


Busca Zonas de Calor Estructurales en la Tienda cTrader.


--------------------------------------------------


ACTUALIZA A INVICTUS EA


Invictus EA utiliza tecnología estructural para ejecutar operaciones automatizadas.


Busca Invictus en la Tienda cTrader.


--------------------------------------------------


NOTAS TÉCNICAS


- Indicador superpuesto

- Funciona en cualquier marco temporal y símbolo

- Sin repintado (cálculo histórico)

- Optimizado para rendimiento


--------------------------------------------------


SOPORTE


Actualizaciones de por vida incluidas.


PARA MÁS INFORMACIÓN - Haz clic en el perfil del desarrollador abajo.

Resumen

Resumen de IA
Fixed Range Volume Profile (FRVP) is a volume profile indicator designed for trading charts that automatically detects the latest trendline drawn by the user. It calculates and displays volume distribution within the fixed range defined by this trendline, eliminating the need for manual range selection. Key features include visualization of the Point of Control (POC) representing the highest volume price level, Value Area High (VAH) and Value Area Low (VAL) defining a configurable percentage (default 70%) of total volume, and High Volume Nodes (HVN) indicating volume above an average threshold. The indicator presents these elements as a histogram on either side of the range, with customizable rows, colors, opacity, and the option to extend lines to the right. Visual elements include yellow horizontal lines for POC, blue dashed lines for VAH and VAL, orange bars for HVN, and shaded regions for the value area. FRVP works on any timeframe and symbol without repainting, providing a stable overlay for volume analysis. Typical use cases involve identifying key volume levels for entries, exits, and profit targets, as well as understanding volume distribution and combining with other indicators for confluence. The indicator supports extensive visual and profile parameter customization to suit individual trading preferences.
Perfil del indicador
Categoría del indicador
Volumen
Tipo de resultado
Visualización
Requisitos de datos
Únicamente barras
Datos de tic
Volumen
Señales admitidas
Fuerza de la tendencia
Volatilidad
Inversión
Ruptura
Rango en la apertura de la sesión
Toque de nivel
Ruptura de nivel
Cruce

Valoraciones de clientes

0.0
Valoraciones: 0
Valoraciones de clientes
Este producto todavía no se ha valorado. ¿Ya lo ha probado? Sea el primero en informar a otros.

Conversación

Preguntas frecuentes

Key Levels
Imbalance
Volume
Los productos disponibles a través de cTrader Store, incluidos bots, indicadores y plugins para operar, son proporcionados por desarrolladores de terceros y están disponibles únicamente con fines informativos y de acceso técnico. cTrader Store no es un bróker, por lo que no proporciona asesoramiento de inversión, recomendaciones personales ni ninguna garantía de rentabilidad futura.

Más de este autor

Indicador
ATR
RSI
+5
Free swing detector with Fibonacci retracement and RSI overlay. Auto-deviation adapts to any timeframe
cBot
ATR
Wedge
+5
15 YEARS RESULTS :Win rate:93% | ROI+19000% | Trades:87,000 | Profit Factor 1.2 | Currency Pairs:22 | $10k to 500k$ |
1.2
Factor de beneficio
Indicador
ATR
BOS
+5
Heat intensity mapping of structural participation. See where price fights, where it accepts, and where it rejects .
Indicador
RSI
Volume
+3
Auto-detects swings, Includes POC, Value Area (VAH/VAL), High Volume Nodes (HVN), Fibonacci retracement, and RSI overlay

Puede interesarle

Indicador
Prop
Forex
+11
🌊 See when the market is truly in play. Tsunami measures Relative Volume by time-of-day 🌊
Indicador
ATR
Channel
Reversal Trap Probability Bands plots a dynamic volatility envelope around price & automatically detects "trap" reversal
Indicador
ATR
The Tenkan-ATR Indicator is a powerful and innovative indicator for Traders. SALE OFF!!!
Indicador
Forex
BTCUSD
+5
This indicator displays the OrderBlocks of the current and higher timeframe, made by ICT's student.
Indicador
ATR
EMA
+5
The indicator displays potential reversal zones (support/resistance) on the chart based on the average range (High–Low)
Indicador
AI
Signal
+1
🔥 THIS BURNS JP225 INDICATOR – Professional Trading Signals
Indicador
Volume
Key Levels
+5
Volume Profile Pro - A Lightweight and Highly Customizable Volume Profile
Indicador
ATR
MSS
+5
Grades ICT Unicorn setups (Breaker Block + FVG confluence) into PRIME / SETUP / WATCH, with retest & RR targets.
Indicador
VWAP
Forex
+13
Custom VWAP Indicator for cTrader
Indicador
Forex
Flexible Volume Profile, designed with performance in mind.
Indicador
Prop
Forex
+10
IBS Indicator – Measures price position within bars for smarter trades. Works on all markets & timeframes.
Indicador
Forex
BTCUSD
+10
6-stage IIR filter trend indicator with colored line segments, reversal signals, alerts, and entry arrows.
Indicador
Indices
Commodities
The Advanced CCI & EMA Indicator combines the CCI with 40 & 80 EMA logic to generate precise arrows signaling direction
Indicador
MACD
Forex
+5
🚀 MACD Pro Trader – Advanced MACD with buy/sell signals, custom MAs & color-coded histograms for smarter trading! 📈🔥
Indicador
ADX
ATR
+5
Identifies TRENDING, RANGING and VOLATILE markets with pullback detection. Anti-noise filter. Works on ANY chart.
Indicador
Forex
EURUSD
+5
Fimathe Indicator - Fimathe PCM - Automated Trend Channels & Levels — Ideal for live trading and backteting
Indicador
Prop
Forex
+13
VIX Pro: Volatility Index Tool with ATR-Based Breakout Alerts
Indicador
Engulfing
Fibonacci
+4
Six higher-timeframe candle sets on one chart, with liquidity sweep detection and swept levels.

Precio

Desde 14/01/2025
2
Ventas
143
Instalaciones gratis





























