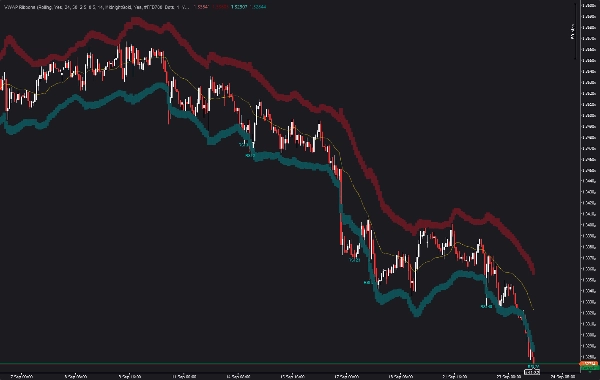
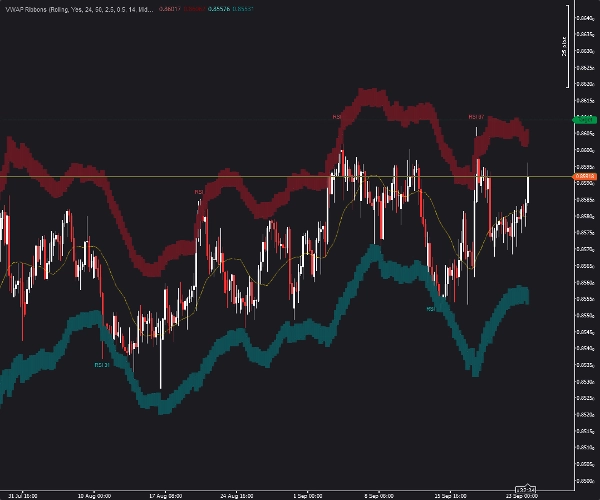
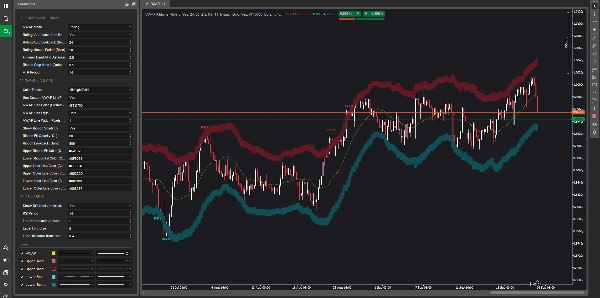
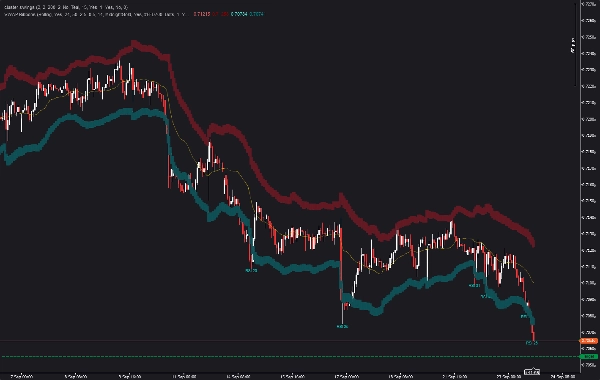
Description
VWAP Ribbons
VWAP + Dual-Layer ATR Ribbon Bands with RSI Labels on Breakout Extremes — Live On-Tick Forming Labels on cTrader
VWAP Ribbons is a cTrader indicator that plots a rolling or daily volume-weighted average price baseline, surrounds it with dual-layer ATR volatility ribbons, and automatically labels the RSI value at every completed breakout extreme — including a live label that updates on the currently forming bar as price pushes to a new extreme.
Built for traders who want clean volatility context around VWAP without clutter, plus the RSI context at the exact bar where price stretched beyond the outer ribbon.
cTrader Native • No Repainting on Completed Bars • Live On-Tick Forming Labels • Five Theme Presets
What the Indicator Does
VWAP Ribbons answers one core question:
Where is price trading relative to volume-weighted fair value — and how stretched is the current move?
The indicator displays:
- A VWAP baseline (rolling window or daily reset)
- Inner ATR band (k multiple)
- Outer ATR band (k + step multiple)
- Optional ribbon shading between inner and outer bands
- RSI labels at each completed breakout extreme
- Live RSI label tracking the currently forming breakout
Breakouts are defined as any bar whose high touches or exceeds the outer upper band (or low touches/exceeds the outer lower band), with the label anchored to the extreme bar of that excursion — not the entry or exit bar.
Core Components
VWAP Baseline
Two modes available:
- Rolling Window — continuously updated VWAP over the last N bars. Auto mode derives bar count from your timeframe (default 24 hours of data). Manual mode lets you specify bar count directly.
- Daily Reset — VWAP resets at the start of each trading day.
Dual-Layer ATR Ribbon Bands
Inner and outer volatility bands plotted around the VWAP baseline using Average True Range (Wilder's smoothing to match MetaTrader). The inner band sits at k × ATR; the outer band sits at (k + step) × ATR. Bands expand and contract naturally with volatility.
Ribbon Shading
Optional semi-transparent fill between the inner and outer bands, creating a visual channel. Opacity is configurable. Ribbon drawing is bounded by a lookback limit to keep performance smooth on long histories.
RSI Labels on Completed Breakouts
Every completed breakout extreme receives an RSI label. The label is anchored to the extreme bar's high (for upper breakouts) or low (for lower breakouts), offset by a configurable ATR distance. The label shows the RSI value at that bar.
Live Forming Breakout Labels
A dedicated live label tracks the currently forming bar's breakout excursion in real time. As price pushes to a new extreme on the forming candle, the label follows. When the bar closes, the live label transitions into the confirmed breakout label list.
How It Works
- VWAP is computed over the selected lookback using typical price × volume ÷ total volume. Cumulative sum arrays deliver exact O(1) per-bar cost regardless of window size.
- ATR (Wilder's smoothing) is calculated over the configured period. Inner and outer bands are plotted at
kandk + stepmultiples above and below the VWAP baseline. - A state machine tracks upper and lower excursions:
- An excursion begins when price touches or exceeds the outer band.
- The extreme bar and extreme price are updated as price pushes further.
- The excursion ends when price closes back inside the inner band.
- The extreme bar is recorded as a completed breakout.
- RSI labels are drawn at the extreme bar of each completed breakout.
- A live label is maintained on the currently forming bar, updating on every tick until the bar closes.
What You See on the Chart
- VWAP line (custom color, style, and pixel width)
- Four band boundary lines (inner dotted, outer solid — upper and lower)
- Optional ribbon shading between inner and outer bands
- RSI labels above upper breakout extremes (showing RSI at that bar)
- RSI labels below lower breakout extremes (showing RSI at that bar)
- Live RSI label tracking the current forming breakout
Five theme presets:
Midnight Gold · Neon · Ocean · Light Chart · Custom
Historical, Live & Non-Repainting Behavior
All completed breakout calculations use closed bars only. Once a bar closes and a breakout extreme is recorded, the label does not change.
The live forming breakout label updates tick-by-tick as the current bar develops — this is a provisional reading and is not final until the bar closes. When the bar closes, the excursion is either confirmed as a completed breakout (and a permanent label is placed) or dropped if price closed back inside the inner band.
The live label is visually identical to the completed labels but always reflects the forming bar's current state.
Parameter Architecture
01. Core — VWAP + Bands
VWAP Mode (Rolling / Daily) · Rolling Auto (bars from timeframe) · Rolling Auto Lookback (hours) · Rolling Manual Period (bars) · k — Inner Band ATR Distance · Ribbon Step from k · ATR Period
02. Theme + Colors
Theme Preset · Custom VWAP Line toggle · VWAP Line Color · VWAP Line Style · VWAP Line Width · Ribbon Shading toggle · Ribbon Fill Opacity · Ribbon Lookback Bars · Upper / Lower Ribbon Fill Colors · Upper Inner / Outer / Lower Inner / Outer Line Colors
03. RSI Labels
Show RSI Labels · RSI Period · Last N Breakouts to Label · Label Font Size · Label Distance from Extreme (× ATR)
Practical Market Scenarios
Price Extends Beyond Outer Band and Closes Back Inside
Price rallies through the inner and outer upper bands, printing a new swing high. An RSI label is placed at that extreme bar showing the RSI reading at the moment of maximum stretch. If RSI was above 70, the label visually flags an overbought excursion at the outer band.
Sustained Trend with Multiple Breakouts
Price grinds higher over many bars, repeatedly pushing beyond the outer band. Each new extreme that closes back inside the inner band is recorded as a separate breakout event, with its own RSI label. The cluster of labels quickly reveals whether RSI is rising, flat, or diverging across successive pushes.
Live Forming Breakout
Price is currently pressing against the outer upper band. A live RSI label tracks the current forming bar's extreme. As the bar develops, the label updates tick-by-tick. When the bar closes inside the inner band, the label transitions to a permanent completed breakout label.
Ribbon Compression and Expansion
Ribbon width expands during trending moves and contracts during quiet periods. When the ribbon narrows, price frequently closes back inside the inner band quickly after touching the outer band — indicating shallow excursions. When the ribbon widens, excursions tend to hold longer.
Compatibility
- Platform: cTrader (cAlgo API)
- Asset classes: Forex, metals including XAUUSD, indices including US30, NAS100, and GER40, commodities, and crypto instruments
- Timeframes: M5, M15, H1, H4, Daily
- Volume data: Broker-supplied tick volume
- Dependencies: None. Native cAlgo, no external libraries
Technical Notes
The indicator is written entirely in cAlgo (C#). The rolling VWAP uses cumulative sum arrays — per-bar cost stays constant regardless of window length. All completed breakout logic uses closed-bar data.
The breakout state machine tracks the highest high (for upper excursions) or lowest low (for lower excursions) as long as price remains beyond the outer band. The extreme bar recorded is the bar at which the excursion reached its maximum — not the entry or exit bar.
Live forming labels are drawn as chart text objects with unique names per extreme timestamp, ensuring smooth updates without object churn. Completed labels are tracked and cleaned up automatically when they fall outside the "Last N" window.
Ribbon fill uses rectangle chart objects with automatic vertical connectors, ensuring seamless shading between bars.
Who Is This Indicator For?
VWAP Ribbons suits traders who want:
- Clean VWAP reference with volatility context
- Visible ATR-based ribbon for stretch analysis
- RSI readings at the exact bar of maximum price stretch
- Live tracking of the current forming breakout
- Minimal chart clutter with configurable ribbon lookback
Use it alongside broader methodologies involving price action, volume analysis, mean reversion, or trend continuation.
The indicator provides analytical visualization — not a buy or sell signal.
Purchase
VWAP Ribbons is available through the cTrader Store. Your purchase includes lifetime access, five theme presets, and direct developer support.
VWAP Ribbons — cTrader VWAP Indicator | Rolling VWAP | Daily VWAP | ATR Bands | ATR Ribbon | VWAP Ribbon | RSI Labels | Breakout Labels | Live Forming Labels | cTrader Indicator | cAlgo Indicator | Non-Repainting Signals | Volume Weighted Average Price | XAUUSD Indicator | US30 Indicator | NAS100 Indicator | Mean Reversion | Volatility Bands | Overbought Oversold
Summary
Key features include customizable VWAP modes, ATR band multipliers, optional shaded ribbons between bands, and configurable RSI label display. Breakouts are identified by excursions beyond the outer bands that close back inside the inner bands, with labels anchored to the extreme bar of each breakout. The indicator supports multiple timeframes (M5 to Daily) and asset classes including Forex, metals (e.g., XAUUSD), indices (e.g., US30, NAS100), commodities, and cryptocurrencies, using broker-supplied tick volume data.
VWAP Ribbons is designed for traders seeking clear volatility and momentum context around VWAP with minimal chart clutter. It provides analytical visualization without generating buy or sell signals. Five theme presets and extensive customization options are included.