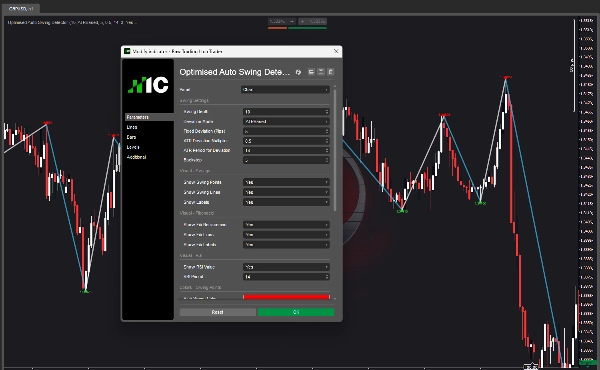
Optimised Auto Swing Detector
Indicator
121 downloads
Version 1.0, Jun 2026
Windows, Mac
5.0
Reviews: 2
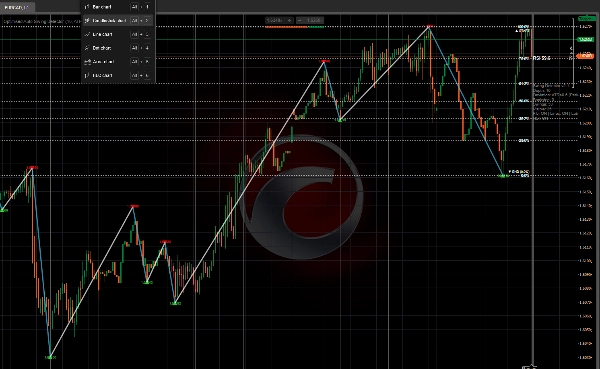
Trading product for Optimised Auto Swing Detector Indicator Fibonacci Supertrend, image 2
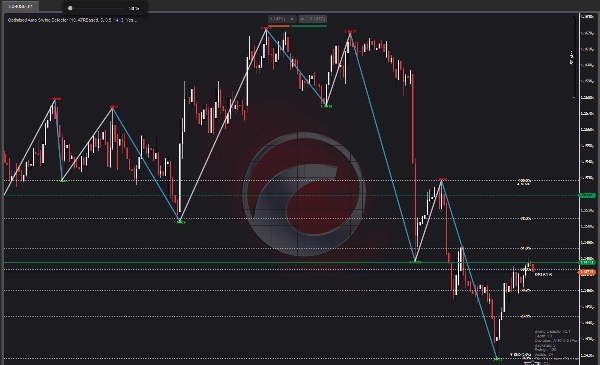
Trading product for Optimised Auto Swing Detector Indicator Fibonacci Supertrend, image 3
Trading product for Optimised Auto Swing Detector Indicator Fibonacci Supertrend, image 4
Since 14/01/2025
1
Sales
121
Free installs

Description

SWING DETECTOR

Structural Swing Points + Fibonacci Retracement + RSI


--------------------------------------------------


FREE INDICATOR


Identify structural swings. See the trend. Trade with confluence.


--------------------------------------------------


WHAT THIS INDICATOR DOES


Swing Detector identifies structural swing highs and lows using local extrema detection with configurable depth and auto-deviation filtering.


It then connects swings with trend lines, overlays standard Fibonacci retracement levels, and displays current RSI value near price.


--------------------------------------------------


KEY FEATURES


- Swing point detection (configurable depth)

- AUTO-DEVIATION: ATR-based filtering adapts to any timeframe

- Fixed pip deviation mode (for manual control)

- Swing trend lines (upswing blue, downswing orange)

- FIBONACCI RETRACEMENT (0, 23.6, 38.2, 50, 61.8, 78.6, 100 percent)

- RSI VALUE OVERLAY (current RSI near price)

- Customizable colors

- Performance-optimized (max bars to draw)


--------------------------------------------------


AUTO-DEVIATION - KEY FEATURE


Two deviation modes available:


- FIXED PIPS: Set a fixed minimum pip distance between swings

- ATR-BASED (AUTO): Dynamic deviation based on current volatility


WHY AUTO-DEVIATION MATTERS:


- M1 to M5: Tight deviation (captures small swings)

- H1 to H4: Medium deviation (captures structure)

- D1 to MN1: Wide deviation (captures major swings)


The indicator automatically adapts to the timeframe you are using. No manual adjustment needed when switching charts.


This makes Swing Detector usable across ALL timeframes — from 1-minute to monthly charts.


--------------------------------------------------


FIBONACCI RETRACEMENT - KEY FEATURE


For the last completed swing, the indicator draws:


- 0.0 percent (start of swing)

- 23.6 percent

- 38.2 percent

- 50.0 percent

- 61.8 percent

- 78.6 percent

- 100.0 percent (end of swing)


Toggle lines and labels on/off. All levels are color-coded for quick visual reference.


--------------------------------------------------


RSI OVERLAY - KEY FEATURE


Current RSI value is displayed near price with color coding:


- RED: RSI above 70 (overbought)

- GREEN: RSI below 30 (oversold)

- WHITE: RSI between 30 and 70 (neutral)


This provides immediate momentum context without opening a separate RSI window.


--------------------------------------------------


VISUAL ELEMENTS


- Red down arrows = Swing highs

- Green up arrows = Swing lows

- Blue lines = Upswing (low to high)

- Orange lines = Downswing (high to low)

- Gold horizontal lines = Fibonacci levels

- White labels = Fibonacci percentages

- RSI value = Current RSI near price

- Info panel = Depth, deviation, backstep, swing count


--------------------------------------------------


PARAMETER OVERVIEW


SWING SETTINGS:

- Swing Depth: How many bars to check for local extrema

- Deviation Mode: Fixed Pips or ATR-Based (Auto)

- Fixed Deviation: Minimum pip distance between swings

- ATR Deviation Multiplier: Multiplier for ATR-based deviation

- ATR Period: Period for ATR calculation

- Backstep: Minimum bars between swings


VISUAL - SWINGS:

- Show Swing Points: Toggle arrows

- Show Swing Lines: Toggle trend lines

- Show Labels: Toggle price labels


VISUAL - FIBONACCI:

- Show Fib Retracement: Toggle Fibonacci overlay

- Show Fib Lines: Toggle horizontal lines

- Show Fib Labels: Toggle percentage labels


VISUAL - RSI:

- Show RSI Value: Toggle RSI overlay

- RSI Period: Period for RSI calculation


COLORS:

- High Swing Color

- Low Swing Color

- Upswing Line Color

- Downswing Line Color

- Fib Line Color

- Fib Text Color

- RSI Label Color


PERFORMANCE:

- Max Bars to Draw: Limits drawing for faster performance


--------------------------------------------------


USE CASES


- Identify structural swing points on ANY timeframe

- Draw trend lines between swings

- Use Fibonacci levels for entries, exits, and profit targets

- Confirm trades with RSI confluence

- Understand market structure at a glance

- Switch timeframes without adjusting parameters (Auto-Deviation)


--------------------------------------------------


TIMEFRAME USABILITY


With AUTO-DEVIATION enabled, the indicator works across:


- M1, M5, M15 (scalping)

- M30, H1, H4 (day trading)

- D1 (swing trading)

- W1, MN1 (position trading)


One indicator. All timeframes.


--------------------------------------------------


UPGRADE TO STRUCTURAL HEAT ZONES


This free indicator shows you swings and structure.


Structural Heat Zones takes it further — it maps participation intensity, acceptance vs rejection, and market engagement across multiple zones.


Search for Structural Heat Zones in the cTrader Store.


--------------------------------------------------


UPGRADE TO INVICTUS EA


Invictus EA uses the same structural technology to execute automated trades.


Search for Invictus in the cTrader Store.


--------------------------------------------------


TECHNICAL NOTES


- Overlay indicator

- Works on any timeframe and symbol

- No repainting (swings are historical)

- Optimized for performance


--------------------------------------------------


SUPPORT


Lifetime updates included.


FOR MORE INFORMATION - Click Developer's Profile below.

Summary

AI summary
Optimised Auto Swing Detector is a free overlay indicator designed to identify structural swing highs and lows across all timeframes and symbols. It uses local extrema detection with configurable depth and an ATR-based auto-deviation filter that dynamically adapts to market volatility, enabling seamless use from 1-minute to monthly charts without manual adjustments. The indicator connects swing points with color-coded trend lines (blue for upswings, orange for downswings) and overlays Fibonacci retracement levels (0%, 23.6%, 38.2%, 50%, 61.8%, 78.6%, 100%) for the last completed swing, with toggleable lines and labels for visual clarity. It also displays the current RSI value near the price, color-coded to indicate overbought (red), oversold (green), or neutral (white) momentum conditions, providing immediate momentum context without a separate RSI window. Users can customize colors, toggle visual elements (swing points, lines, Fibonacci overlays, RSI), and optimize performance by limiting bars drawn. Key parameters include swing depth, deviation mode (fixed pips or ATR-based), ATR period and multiplier, and backstep between swings. The indicator supports use cases such as identifying market structure, drawing trend lines, applying Fibonacci levels for trade entries/exits, and confirming trades with RSI confluence. It is optimized for performance and does not repaint historical swings.
Indicator profile
Indicator category
Trend
Output type
Visualisation
Data requirements
Bars only
Tick data
Supported signals
Trend strength
Volatility

Customer reviews

5.0
Reviews: 2
5
100 %
4
0 %
3
0 %
2
0 %
1
0 %
Customer reviews
July 16, 2026
Optimised Auto Swing Detector is a fantastic all-in-one structural tool. It automatically maps swing highs/lows using a brilliant ATR-based auto-deviation feature, meaning it works flawlessly from M1 to MN1 without tweaking settings. It also overlays Fibonacci retracement on the last completed swing and displays a color-coded RSI value right next to price.
June 30, 2026
Aesthetically crisp and configurable! Divergence, Swings, ATR andFibo all in one compact indicator,. Has been coded lightweight, fast and accuarte. If only in the future some alerts on RSI / Fibo zone? Great work my friend!! Looking forward to seeing more of your work :) Good luck trading...

Discussion

FAQ

Fibonacci
Supertrend
Key Levels
RSI
Market Structure
ATR
Support & Resistance
Products available through cTrader Store, including trading bots, indicators and plugins, are provided by third-party developers and made available for informational and technical access purposes only. cTrader Store is not a broker and does not provide investment advice, personal recommendations or any guarantee of future performance.

More from this author

cBot
ATR
Wedge
+5
15 YEARS RESULTS :Win rate:93% | ROI+19000% | Trades:87,000 | Profit Factor 1.2 | Currency Pairs:22 | $10k to 500k$ |
1.2
Profit factor
Indicator
ATR
BOS
+5
Heat intensity mapping of structural participation. See where price fights, where it accepts, and where it rejects .

You may also like

Indicator
Forex
Crypto
+2
HTF Candle
Indicator
BOS
EMA
+5
Directional volume heatmap: see if a price zone was built on buying or selling, not just how much.
Indicator
AI
ATR
+12
Indicator that auto-calculates SL/TP via volatility. 3 layers: digital filtering, recursive Bayes, adaptive factor
Indicator
AI
ATR
+27
An advanced VWAP with multi-VWAP (Daily/Weekly/Monthly/Anchored), click-to-anchor, configurable alerts, a stats panel,
Indicator
AI
Grid
+10
Crossover Buy and Sell Alerts and signals
Indicator
ATR
Forex
+7
Final Moving Average is an adaptive system designed to keep traders aligned with the true direction of the market
Indicator
RSI
Key Levels
+3
MARCs Multi-timeframe market dashboard with trend rows, RSI context, sessions, presets and optional chart levels.
Indicator
Forex
BTCUSD
+10
MultiTimeframe MA
Indicator
RSI
Forex
+6
🚀 QQEX Trinity Indicator - The Ultimate Trading Filter 🚀
Indicator
ATR
Forex
+6
The Smart Money Concepts indicator is an all-in-one overlay tool that automatically detects OB, FVG ecc..
Indicator
Prop
Forex
+4
Universal multi time frame 'Moving Average' indicator with extended features
Indicator
Forex
EURUSD
+4
A precision overlay tool that combines session-aware VWAP logic and standard deviations.
Indicator
VWAP
Volume
+4
Advanced Order Flow & Volume Profiling for cTrader. Unveil institutional footprints, Delta, and Anchored VWAPs.
Indicator
SMC
Forex
+5
Pinpoint FVGs, track fills and see mitigation stats — trade imbalances with clarity and confidence.
Indicator
Key Levels
Liquidity Sweep
Professional Opening Range Breakout, Initial Balance, False breakout Detection
Indicator
Prop
VWAP
+9
VWAP Pro – The Ultimate VWAP 💎💰
Indicator
SMC
Prop
+14
BoS ChoCH Pro,Strict Mode,False Breakout Filter,Average hit rate: 72-78%
Indicator
Key Levels
Order Block
+2
It monitors trend lines on price charts and fires multi-channel alerts and optionally places trades when price crosses..

Price

Since 14/01/2025
1
Sales
121
Free installs