

Description
STRUCTURAL HEAT ZONES
Participation Intensity Map
--------------------------------------------------
See where price fights. See where it ignores.
Most support/resistance tools draw lines where price WAS.
Structural Heat Zones answers: Does the market actually CARE about this level?
--------------------------------------------------
HEAT INTENSITY SCORING (0 to 100)
The indicator analyzes swing clustering and assigns a heat score:
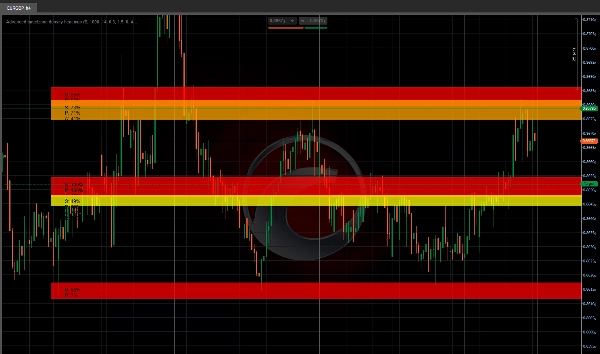
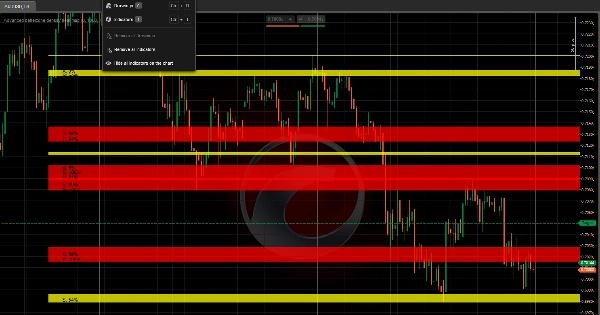
- Red zones (80 to 100 heat) = Strongest structural participation
- Orange zones (60 to 80 heat) = Active structural zone
- Yellow zones (40 to 60 heat) = Moderate interest
- Blue zones (below 40 heat) = Weak structure
Higher heat = more swings clustered = more market attention.
--------------------------------------------------
ACCEPTANCE VS REJECTION TRACKING
For each structural heat zone, the indicator tracks price behavior:
- ACCEPTANCE = Price closes inside the zone (support behavior)
- REJECTION = Price leaves long wicks at the zone (resistance behavior)
This tells you whether a zone is likely to HOLD or REVERSE.
--------------------------------------------------
MARKET ENGAGEMENT ANALYSIS
The system measures:
- Candle touches (how often price visits each zone)
- Closes inside (acceptance rate)
- Wick rejections (rejection rate)
- Configurable lookback period
Low engagement = weak zone. High engagement = structural heat zone.
--------------------------------------------------
VISUAL INTENSITY MAPPING
- Color-coded zones by heat score (red = hottest)
- Halo extensions for rejection visualization
- Data labels showing: Heat / Participation / Acceptance / Rejection scores
- Auto-cleaning (zones redraw automatically)
- Optional swing high/low arrows
--------------------------------------------------
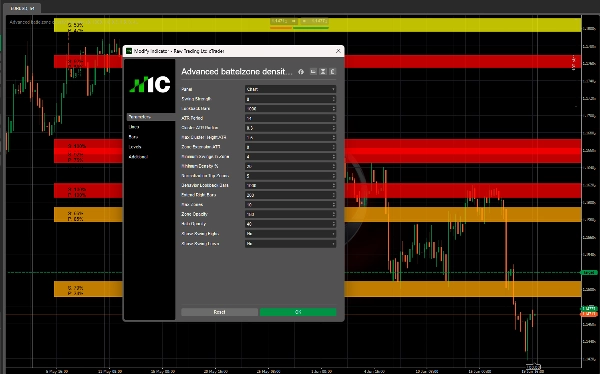
KEY PARAMETERS
- Swing Strength: Pivot sensitivity (higher = fewer swings)
- Lookback Bars: How far back to detect swings
- ATR Period: For adaptive radius calculation
- Cluster ATR Radius: How close swings must be to cluster
- Max Cluster Height ATR: Rejects zones wider than this
- Zone Extension ATR: Halo size for rejection detection
- Minimum Swings In Zone: Minimum cluster size
- Minimum Heat Score: Only show zones above this
- Behavior Lookback Bars: Period for engagement tracking
- Max Zones: Maximum zones displayed
- Zone / Halo Opacity: Visual transparency
--------------------------------------------------
USE CASES
- Find genuine structural heat zones (high heat + high engagement)
- Distinguish acceptance zones from rejection zones
- Avoid low-heat, low-participation areas
- Identify structural clusters for entry and exit placement
- Confluence with trend indicators or order flow
--------------------------------------------------
TECHNICAL NOTES
- Overlay indicator (draws on price chart)
- Works on any timeframe and symbol
- Auto-adapts to volatility via ATR
- No repainting (swings are historical)
--------------------------------------------------
FROM THE MAKERS OF INVICTUS EA
Structural Heat Zones shares the same structural participation technology found in the Invictus automated trading system.
--------------------------------------------------
RISK DISCLOSURE
This indicator is an analytical tool. It does not generate automated trading signals. All trading decisions remain the responsibility of the user.
--------------------------------------------------
SUPPORT
Lifetime updates included.
FOR MORE INFORMATION - Click Developer's Profile below.
Summary
Key features include color-coded heat zones, halo extensions for rejection visualization, and data labels displaying heat, participation, acceptance, and rejection scores. The system measures candle touches, closes inside zones, and wick rejections over a configurable lookback period to quantify market engagement. Adjustable parameters allow customization of swing sensitivity, cluster radius, zone size, and visual opacity.
This tool supports any timeframe and symbol, adapts to volatility using ATR, and does not repaint historical swings. It is intended for identifying genuine structural heat zones, differentiating acceptance from rejection areas, and aiding entry and exit placement in conjunction with other trend or order flow indicators. The indicator is analytical and does not generate automated trading signals.
Customer reviews
5 | 100 % | |
4 | 0 % | |
3 | 0 % | |
2 | 0 % | |
1 | 0 % |





























