

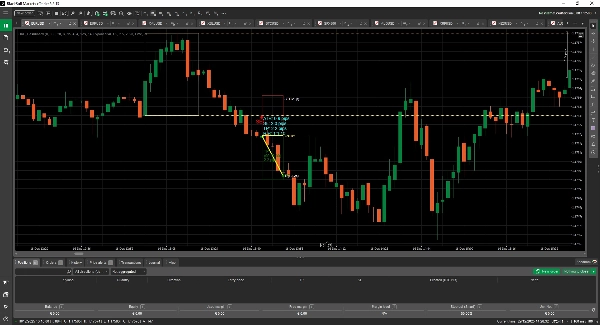

Description
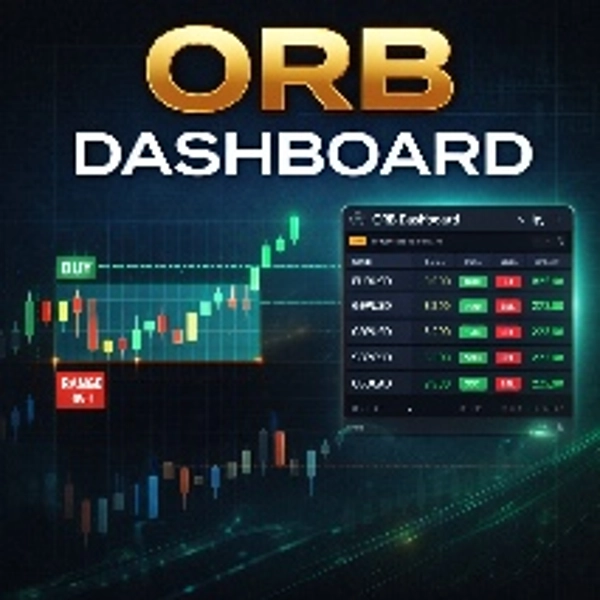
Transform your trading with our ATR-Enhanced ORB (Opening Range Breakout) Indicator!
It's a complete professional trading system that automatically detects high-probability breakout opportunities while dynamically adjusting risk management based on real market volatility.
How It Works:
Step 1: Smart Opening Range Detection
- Automatically identifies the critical opening range (OR) period (configurable hours)
- Calculates precise high/low boundaries that institutional traders watch
- Draws clear visual extensions for easy trading throughout the session
Step 2: Breakout Confirmation System
- Waits for consecutive closes above/below OR boundaries (configurable 1-10 bars)
- Eliminates false breakouts with proven confirmation logic
- Plots professional trade arrows only when conditions are met
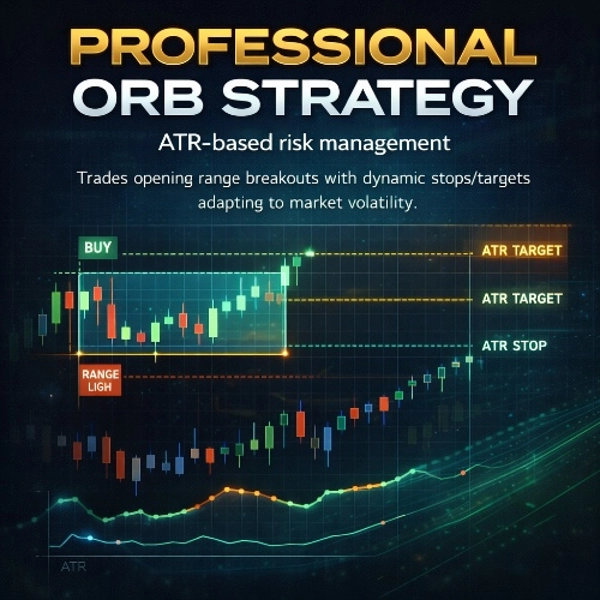
Step 3: ATR-Adaptive Risk Management
- Dynamic Stops: Automatically adjusts stop loss based on current ATR (Average True Range)
- Smart Targets: Sets take profit levels using ATR multipliers (1:1.5 to 1:5 ratio)
- Volatility Adaptation: Tight stops in quiet markets, wider stops in volatile markets
- Minimum Protection: Never sets stops below your defined minimum pip distance
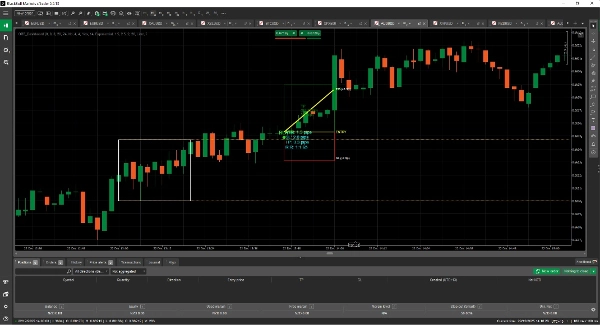
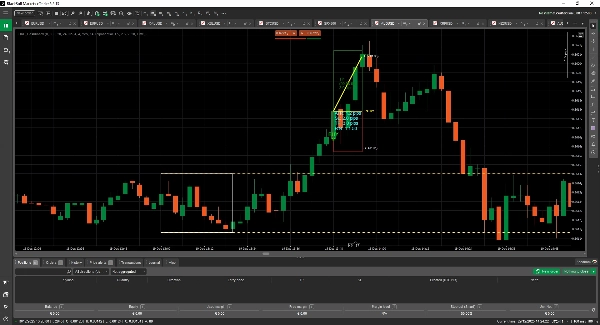
Step 4: Complete Trade Visualization
- Color-coded TP/SL zones (Green for profit, Red for stop)
- Real-time ATR value display with pip calculations
- Risk-Reward ratio shown on every trade
- Trade outcome tracking (TP/SL) with duration and pips gained
Key Features That Make You Money:
✅ Professional-Grade ATR Integration
- Stops/targets automatically adjust to market conditions
- No more guessing where to place your stops!
- Adaptive to any timeframe (M1 to Daily)
✅ No Repaint, No Redraw
- Signals appear only when confirmed
- No disappearing arrows or fake signals
- Trades remain visible for analysis
✅ Complete Visual Dashboard
- Opening range high/low lines with extensions
- Trade entry/exit markers with labels
- Performance statistics on every trade
- Clean, professional chart presentation
✅ Smart Trade Management
- One trade per OR period (prevents over-trading)
- Automatic TP/SL hit detection
- Trade outcome tracking and statistics
- Visual trade path from entry to exit
✅ Fully Customizable
- Adjust OR hours to any market session
- Modify confirmation requirements
- Customize ATR multipliers and period
- Change colors and visual settings
Who This Is For:
🔹 Swing Traders - Catch major daily breakouts with professional risk management
🔹 Day Traders - Trade opening range breakouts on lower timeframes
🔹 Risk-Averse Traders - Let ATR determine your risk, not emotions
🔹 Algorithmic Traders - Use as signal generator for automated systems
🔹 Trading Educators - Perfect tool for teaching ORB strategy and risk management
Why Buy Our Indicator vs. Building Your Own?
- Proven Logic - Years of refinement in entry/exit logic
- ATR Intelligence - Sophisticated volatility-based position sizing
- Production Ready - No bugs, tested across multiple markets
- Time Savings - Hundreds of hours of development for fraction of cost
- Support Included - Regular updates and technical support
Technical Requirements:
- Works on cTrader platform
- Compatible with all currency pairs and timeframes
- Low CPU usage for multi-chart operation
- No external dependencies required
Risk Disclaimer:
This is a tool, not a guarantee of profits. Past performance doesn't guarantee future results. Always practice proper risk management and test strategies on demo accounts first.
Summary
Risk management adapts dynamically using the Average True Range (ATR) to set stop-loss and take-profit levels, adjusting for market volatility with customizable ATR multipliers and minimum stop distances. The dashboard provides real-time ATR values, color-coded profit and stop zones, risk-reward ratios, and tracks trade outcomes including duration and pips gained.
Key features include no repaint or redraw signals, one trade per opening range period to prevent over-trading, automatic trade outcome detection, and comprehensive visual trade management. The indicator is fully customizable for opening range hours, confirmation bars, ATR settings, and visual appearance. It supports all currency pairs and timeframes from 1 minute to daily, with low CPU usage and no external dependencies.
ORB_Dashboard suits swing traders, day traders, risk-averse traders, algorithmic traders, and educators seeking a refined ORB strategy with integrated volatility-based risk controls.
Customer reviews
5 | 57 % | |
4 | 43 % | |
3 | 0 % | |
2 | 0 % | |
1 | 0 % |
Discussion
FAQ


















Price