
Описание
Представляем индикатор True Strength Index (TSI) — мощный инструмент, разработанный для улучшения вашей торговой стратегии, предоставляя четкое понимание рыночного импульса и силы тренда.
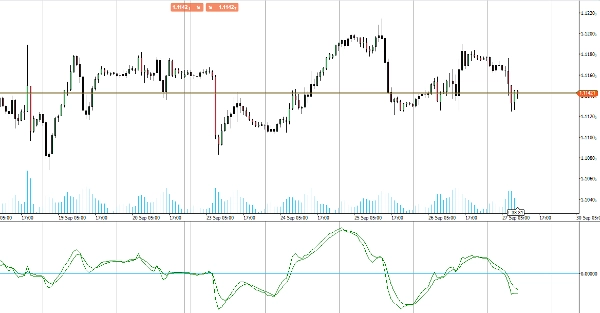
Индикатор TSI измеряет базовую силу ценовых движений, сглаживая рыночный шум, чтобы дать вам более точное представление о направлении тренда. Подчеркивая состояния перекупленности и перепроданности, TSI помогает выявлять потенциальные точки разворота и подтверждать продолжение тренда.
TSI использует скользящие средние базового импульса финансового инструмента. Импульс считается опережающим индикатором ценовых движений, а скользящая средняя, как правило, отстает от цены. TSI сочетает эти характеристики, создавая индикатор цены и направления, более синхронизированный с рыночными поворотами, чем импульс или скользящая средняя по отдельности.
Идеально подходит для трейдеров, стремящихся усовершенствовать свой анализ и улучшить принятие решений, индикатор TSI предлагает надежный и интуитивно понятный способ оценки рыночной динамики. Обновите свой торговый набор инструментов с помощью True Strength Index для достижения превосходных торговых результатов.


