
Penerangan
📈 Penunjuk ini adalah alat yang membantu kami mengenal pasti dan memvisualisasikan arah aliran dalam carta harga. 📊 Operasinya berdasarkan pengiraan tahap aliran menggunakan purata bergerak eksponen dan ukuran volatiliti untuk menentukan zon di mana harga dijangka bergerak. Di bawah, saya akan terangkan dengan terperinci bagaimana ia berfungsi:
📐 Pengiraan Tahap Aliran
Penunjuk bermula dengan mengira apa yang dipanggil "tahap asas." Tahap ini diperoleh dengan mengambil purata dua purata bergerak eksponen: satu jangka pendek (berdasarkan panjang yang ditetapkan pengguna, dalam kes ini, 222) dan satu jangka panjang (dua kali ganda panjang yang pertama). Purata ini memberikan kami rujukan untuk aliran keseluruhan.
Seterusnya, volatiliti dikira menggunakan sisihan piawai harga penutupan, dan nilai ini dilicinkan dengan purata bergerak eksponen tambahan. Volatiliti yang dilicinkan didarab dengan parameter yang dipanggil "sensitiviti," yang memberikan kami tahap atas dan bawah di sekitar tahap asas. Tahap ini bertindak sebagai jalur aliran dan membantu mengenal pasti sama ada harga berada di atas atau di bawah aliran.
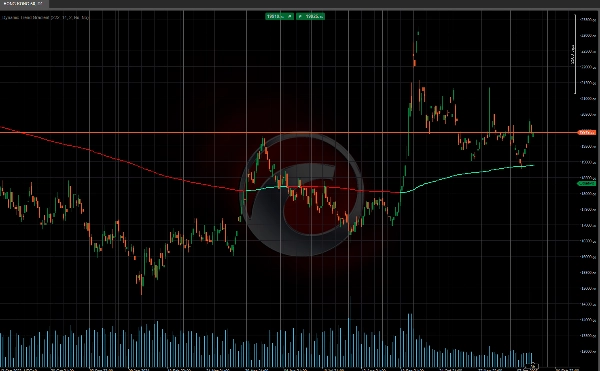
📉📈 Status Aliran
Dengan tahap ini dikira, penunjuk menilai status aliran di pasaran. Jika harga berada di atas tahap asas, ia menganggap aliran menaik 🐂, dan jika di bawah, aliran adalah aliran menurun 🐻. Jika harga melintasi tahap atas atau bawah, penunjuk menukar isyarat alirannya, menunjukkan kemungkinan pembalikan atau perubahan momentum pasaran.
Alat ini sangat sesuai untuk pedagang yang ingin sentiasa mendahului aliran pasaran! 🚀📉📈
Penunjuk Kedai Ctrader:
Struktur Pasaran Dinamik
Analisis Titik Pusing
Fibonacci Linear
Regresi Pelbagai Kerangka Masa
Bias Lilin Berbilang Tahap
Penjejak
Garis Sokongan dan
Rintangan Aliran Auto
Ringkasan
Ulasan pelanggan
5 | 0 % | |
4 | 100 % | |
3 | 0 % | |
2 | 0 % | |
1 | 0 % |


