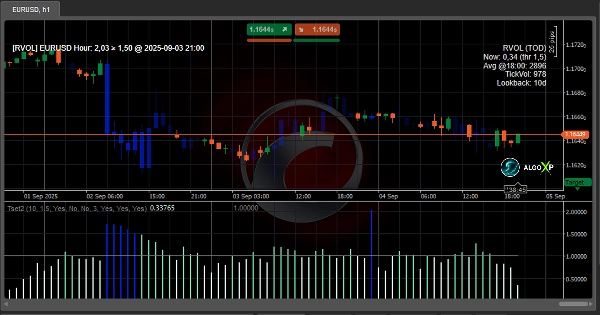
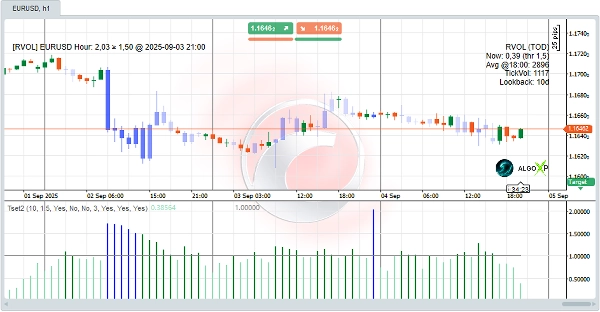
Indikator
NAS100
NZDUSD
XAUUSD
Commodities
Forex
EURUSD
GBPUSD
BTCUSD
Indices
Prop
Stocks
Crypto
USDJPY
Tsunami Volume Surge - RVOL
Logo "Tsunami Volume Surge - RVOL"
26/09/2025
Desktop
Imej yang dimuat naik "Tsunami Volume Surge - RVOL"Imej yang dimuat naik "Tsunami Volume Surge - RVOL"Imej yang dimuat naik "Tsunami Volume Surge - RVOL"

🌊 Tsunami Volume Surge(RVOL + Time-of-Day) is a cTrader indicator designed to show traders when the market is truly active. Instead of looking only at absolute volume, it compares current market activity with its usual levels at the same time of day.

🧠 If volume is significantly higher than normal, the move is more likely driven by real market participants and has greater strength. The indicator highlights these situations using a color-coded histogram, bar coloring on the chart, and convenient alerts.

📊 How to use 

There are many ways to use Tsunami Volume Surge:

  • Visual confirmation
    Colored candles make it easy to see which bars have real energy behind them, without staring at numbers.ts.
  • Filter weak signals
    If volume is below normal (RVOL < 1.0), the market lacks interest. Avoid signals during such conditions.
  • Confirm breakouts
    A breakout supported by high RVOL is far more reliable than one on low volume. Quasar Volume helps you spot the difference.
  • Time-of-day analysis
    Different markets have their own rhythm. This indicator shows at which hours a symbol usually becomes active.
  • News trading
    During major news events, RVOL often spikes. Setting a higher threshold (e.g. 3.0) helps you catch these explosive moves.

Explore more resources and a detailed FAQ on AlgoXP

✅ Main Features

  • Automatic Relative Volume (RVOL) calculation — instantly shows when market activity is above or below its usual level.
  • Color-coded histogram — clear visual separation of low, normal, and high volume bars.
  • Dynamic candle coloring — bars are tinted based on strength of volume; the bigger the surge, the stronger the highlight.
  • Configurable thresholds — set your own sensitivity (e.g. 1.5 for scalping, 3.0 for news trading).
  • Alerts & pop-ups — get notified when volume crosses your chosen threshold, with time and date.
  • Info panel — displays live RVOL values, averages, and settings at a glance.
  • Baseline line (1.0) — quick reference to normal activity levels.
  • Lightweight and fast — designed to run smoothly even on low timeframes (M1, M5).

🎯 Perfect for

  • Algo developers — RVOL values can be used as a filter or condition in automated cBots.ar shading make the trend easy to read.
  • Scalpers — confirm if a breakout or micro-trend has real strength behind it.
  • Intraday traders — identify the most active times of day and avoid quiet periods.
  • Swing traders — filter false moves and focus only on breakouts with strong participation.
  • News traders — instantly see volume spikes during economic releases and react faster.
  • Beginner traders — simple and intuitive visuals make it easy to understand when the market is “alive” or “dead”.


Lebih banyak produk daripada penulis ini
cBot
Grid
XAUUSD
Prop
+3
Maya Gold Grid ATR - TEST VERSION
🌞 Smart Gold Grid. ATR Precision. + 1 800 000% ROI in 6 years backtest 🌞
cBot
Grid
Prop
XAUUSD
+3
Maya Gold Grid ATR
🌞 Smart Gold Grid. ATR Precision. +35% in 30 Days🌞
Indikator
NAS100
NZDUSD
XAUUSD
+11
Samurai Breakout Lite
⚔️Limited version. Draws clean session box (Tokyo / London / New York / Overlap) and optional breakout plan (EP/TP/SL)⚔️
Indikator
NAS100
NZDUSD
XAUUSD
+11
ADXVMA Aurora Trend Filter
⚡ ADXVMA Aurora Trend Filter combines ADX trend strength with an adaptive EMA blend ⚡
Indikator
NAS100
NZDUSD
XAUUSD
+10
Atlas Seasonal Returns Heatmap
🧭 See when your market tends to move—by Month, Day-of-Week, or Hour-of-Day🧭
Indikator
NAS100
NZDUSD
Breakout
+13
Meridian Pivot Points Pro
🚀See the market’s framework, decide faster. Session-Aware Pivots. Auto Presets. Pro-Grade Zones.🚀
Indikator
NAS100
NZDUSD
Breakout
+12
Samurai Breakout Pro II
⚔️Full breakout trading workstation: session box, EP/TP/SL levels, on-chart ✓/✗ outcomes, pro-level analytics and more⚔️
Indikator
NAS100
NZDUSD
XAUUSD
+12
Coral Filter X Pro
🐠 Coral Filter X Pro turns trend detection into a simple, repeatable workflow 🐠
Indikator
NAS100
NZDUSD
XAUUSD
+10
Nebula Range Filter Pro
⚡Nebula Range Filter is a professional trend filter indicator for cTrader⚡
Anda juga mungkin suka
Market_Session_Forex
Market Sessions
Indikator
RSI
Breakout
Supertrend
Market Trend OB
Price action to detect when the market changes trend (MSB) and defines, order blocks , ZigZag etc.📊
price quote
price quote
KDJ
The KDJ oscillator display consists of 3 lines (K, D and J - hence the name of the display) and 2 levels.
Indikator
XAUUSD
Breakout
Forex
+4
Market Bias Gauge
Measure Market Strength at a Glance – Instantly
Indikator
RSI
XAUUSD
Breakout
+4
ICT Power of 3
🎯 Auto-plots key zones (Accumulation, Manipulation, Distribution) . Reveals institutional traps & trends.
Fibonacci Pitchfan
Powerful all-in-one tool for traders seeking a clear, dynamic view of market structure. By merging pivots, trendlines &
Simple MACD Histogram
Simple MACD Histogram with color-coded rising (green) and falling (red) momentum bars.
Indikator
Breakout
Signal
Bollinger
[Hamster-Coder] Bollinger Bands
Bolliger Bands + Hamster-Coder™ Timeframe Decoupling
Supply Demand V1-Premium
Auto-detect supply & demand zones, remove broken levels, and trade smarter with real-time alerts. Precision made simple.
SuperEmaColorRSI
This is a super indicator that integrates the RSI indicator with a dual moving average system.
Vice TrendTrading
Unlike most indicators that show signals blindly, this show valid entries inside TREND ZONES and visual trend BACKTESTS.
E7 Harmonic Structures Basic
E7 Harmonic Structures Basic.
TrendStrengthSignals
Edge-aware clouds + Pro HUD: better entries, calmer exits, adaptive risk.
Indikator
Breakout
VIX - volatility indicator - Renko
Volatility indicator for Renko.
MultiTF-Pivot_SR
MultiTF Pivot and SR Indicator
trPDHLC
this indicator shows previous day high low and closed with precise manner.
Indikator
RSI
Breakout
Supertrend
+1
Momentum Fair Value Gap
It identifies areas of market imbalance (Fair Value Gaps or FVGs) and projects them on the chart in a smart way