present
Registrieren Sie sich und erhalten Sie $50 Rabatt auf Ihren ersten Kauf
Trading product for MACD  -  advanced Indikator BTCUSD Forex, image 1
MACD - advanced
Indikator
5 käufe
Version 1.0, Mar 2026
Windows, Mac
4.3
Bewertungen: 6
Trading product for MACD  -  advanced Indikator BTCUSD Forex, image 2
Trading product for MACD  -  advanced Indikator BTCUSD Forex, image 3
Trading product for MACD  -  advanced Indikator BTCUSD Forex, image 4
Trading product for MACD  -  advanced Indikator BTCUSD Forex, image 5
Trading product for MACD  -  advanced Indikator BTCUSD Forex, image 6
Trading product for MACD  -  advanced Indikator BTCUSD Forex, image 7
Trading product for MACD  -  advanced Indikator BTCUSD Forex, image 8
30
Verkäufe
871
Kostenlose Installationen

Beschreibung

MACD Advanced — Indikatorbeschreibung

MACD Advanced ist ein professionelles Upgrade des klassischen MACD-Indikators für cTrader. Es kombiniert die Standard-MACD-Logik mit einer Vielzahl visueller Werkzeuge und analytischer Ebenen, die Händlern einen viel tieferen Einblick in das Marktmomentum, die Trendstärke und die Volatilitätsbedingungen bieten — alles in einem Panel.


Histogramm mit Momentum-Farbgebung

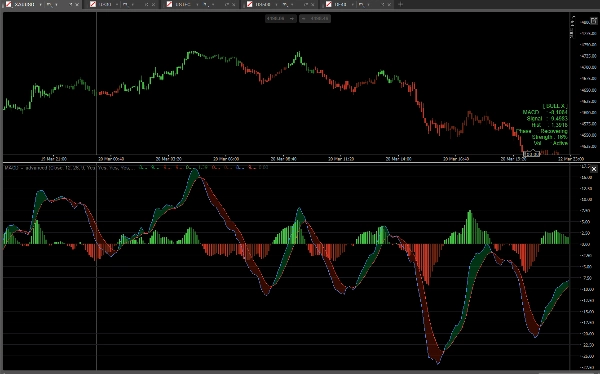
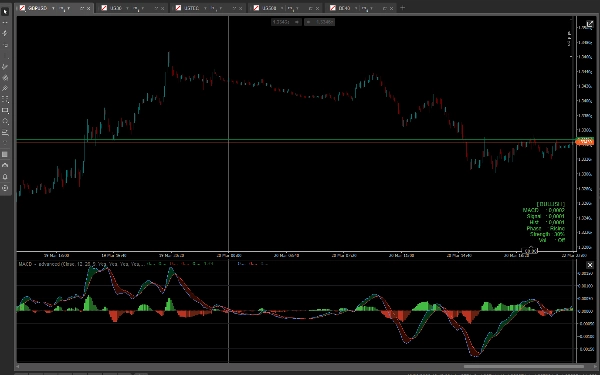
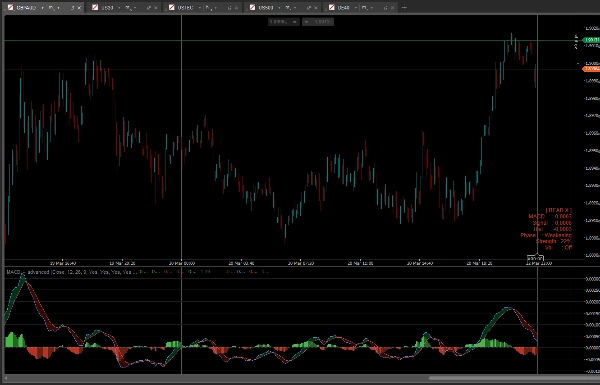
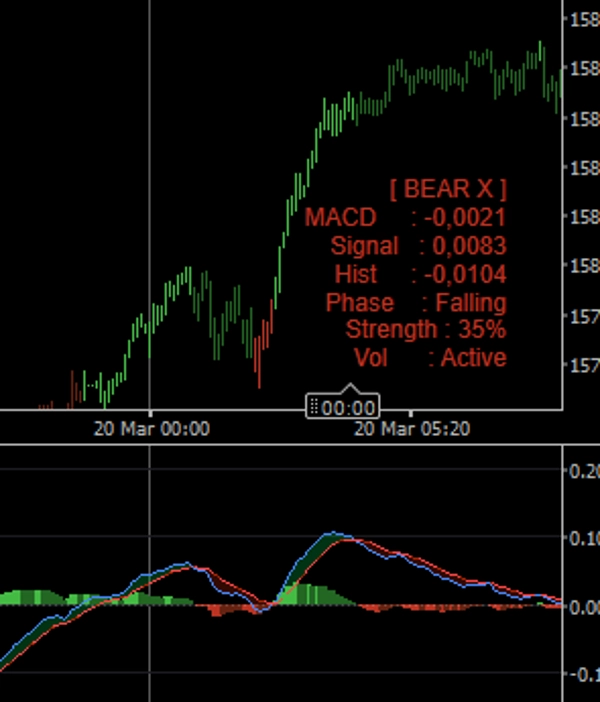
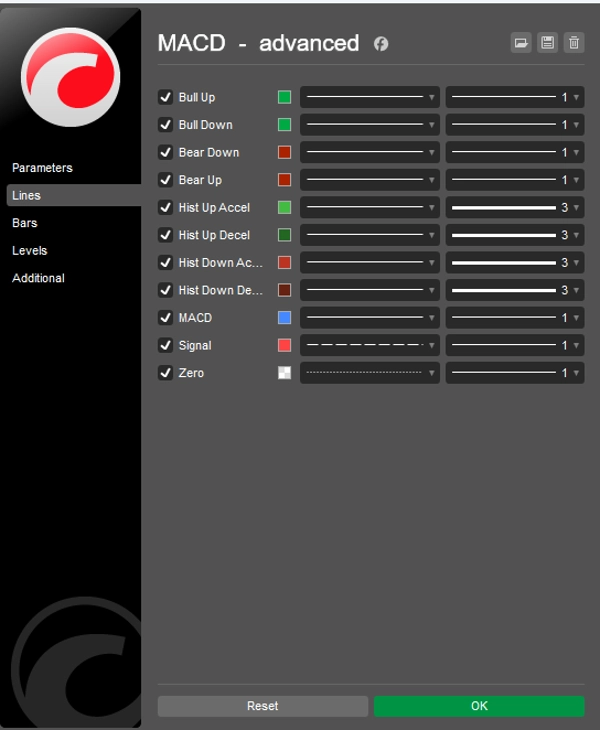
Das Histogramm zeigt die Differenz zwischen den MACD- und Signal-Linien und verwendet vier verschiedene Farben, um vier Marktphasen zu unterscheiden: bullisch beschleunigend, bullisch verzögernd, bärisch beschleunigend und bärisch verzögernd. Dadurch wird sofort klar, ob das Momentum zunimmt oder nachlässt, ohne dass eine manuelle Berechnung erforderlich ist.


MACD-Cloud

Eine optionale Wolke füllt den Bereich zwischen den MACD- und Signal-Linien. Eine grüne Wolke entsteht, wenn der MACD über dem Signal liegt (bullische Tendenz), und eine rote Wolke, wenn der MACD unter dem Signal liegt (bärische Tendenz). Die Wolke bietet auf einen Blick eine sofortige visuelle Darstellung der Trendrichtung.


Trendstärke

Der Indikator berechnet eine Echtzeit-Trendstärkewertung basierend auf der Trennung zwischen den MACD- und Signal-Linien über einen konfigurierbaren Rückblickzeitraum. Das Ergebnis wird als Prozentsatz in der Infotabelle angezeigt und hilft Ihnen, die Stärke oder Schwäche der aktuellen Bewegung einzuschätzen.


Volatilitätsfilter

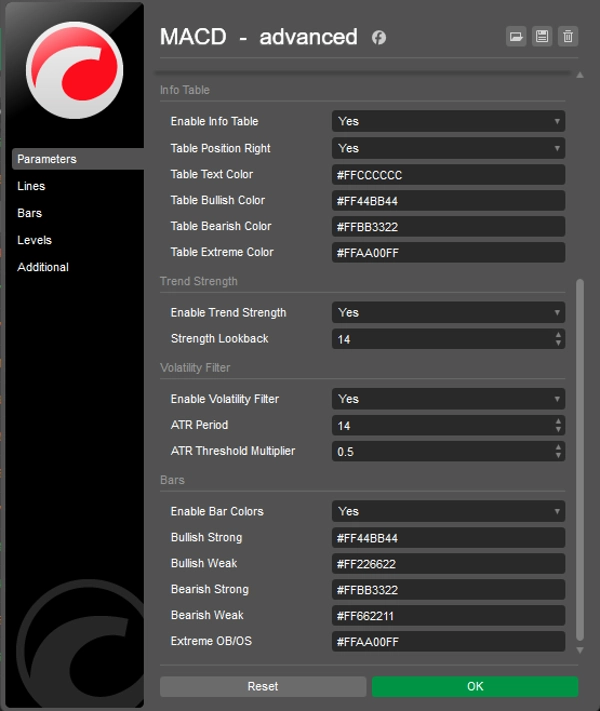
Ein optionaler, auf dem ATR basierender Volatilitätsfilter unterdrückt Signale während Perioden niedriger Volatilität. Wenn aktiviert, ändern sich die Histogrammbalken und deren Farben zu einem neutralen Grau, wenn die Volatilität unter einen konfigurierbaren Schwellenwert fällt, um Fehlinterpretationen in ruhigen Märkten zu vermeiden.


Infotabelle

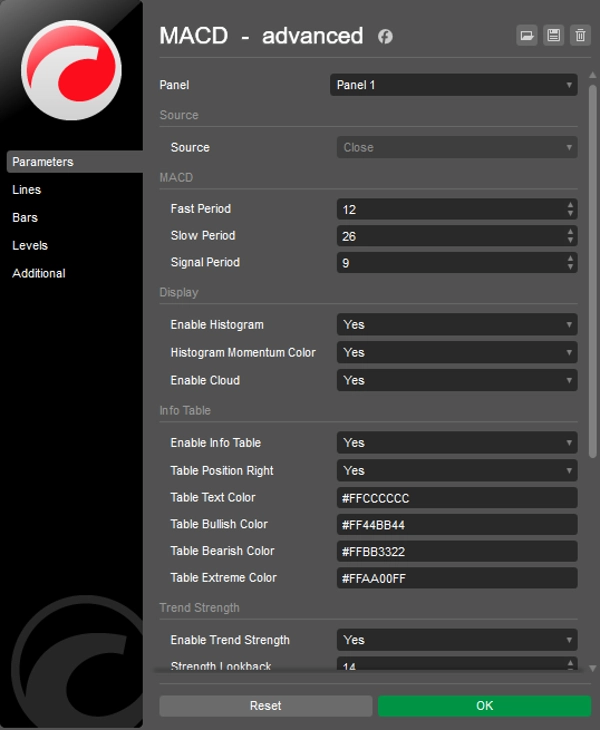
Eine kompakte Tabelle auf dem Chart zeigt den aktuellen Marktstatus (bullisch, bärisch, bullisches Crossover, bärisches Crossover, neutral), exakte MACD- und Signalwerte, Histogrammwert, Zyklusphase (steigend, schwächer werdend, erholend, fallend), Trendstärke in Prozent und den Status des Volatilitätsfilters. Die Tabellenposition (links oder rechts) und alle Farben sind vollständig konfigurierbar.


Balkenfärbung

Wenn aktiviert, färbt der Indikator die Chartkerzen basierend auf den MACD-Bedingungen neu: stark bullisch, schwach bullisch, schwach bärisch, stark bärisch und niedrige Volatilität. Dies bringt das MACD-Signal direkt in den Preischart, ohne dass das Panel gewechselt werden muss.


Zusammenfassung der Hauptmerkmale

  • Vierfarbiges Momentum-Histogramm
  • MACD-Cloud zwischen MACD- und Signal-Linien
  • Echtzeit-Trendstärkewertung in Prozent
  • ATR-basierter Volatilitätsfilter mit visueller Rückmeldung
  • Infotabelle auf dem Chart mit vollständiger Marktstatus-Aufschlüsselung
  • Optionale Kerzenfärbung basierend auf MACD-Bedingungen
  • Alle Farben vollständig anpassbar mit Alphakanal-Unterstützung
  • Sauber und leichtgewichtig — kein Nachzeichnen

Zusammenfassung

KI-Zusammenfassung
MACD Advanced is a professional indicator for cTrader that enhances the classic MACD by integrating multiple visual and analytical tools into a single panel. It provides a detailed view of market momentum, trend strength, and volatility. Key features include a four-color momentum histogram that distinguishes between bullish and bearish acceleration or deceleration, and an optional MACD cloud that visually indicates trend direction by shading the area between the MACD and Signal lines in green or red. The indicator calculates a real-time trend strength score as a percentage based on the MACD and Signal line separation over a configurable period. An optional ATR-based volatility filter suppresses signals during low-volatility phases by changing histogram colors to neutral grey, reducing false signals. A compact on-chart info table displays current market state, MACD and Signal values, histogram data, cycle phase, trend strength, and volatility filter status, with customizable position and colors. Additionally, candle bars can be recolored based on MACD conditions to reflect strong or weak bullish/bearish trends and low volatility directly on the price chart. All colors support alpha channel customization. The indicator is designed to be clean, lightweight, and free from repainting. It supports various markets including Forex, indices, commodities, stocks, and cryptocurrencies.
Indikatorprofil

Kundenbewertungen

4.3
Bewertungen: 6
5
33 %
4
67 %
3
0 %
2
0 %
1
0 %
Kundenbewertungen
April 6, 2026
April 4, 2026
April 1, 2026
the best part is the process slows down in a good way, and a 1R exit plan makes review easier.
March 28, 2026
Helps more when the trader avoids forced trades. Account protection still comes first.
March 27, 2026
Solid enough as a backup opinion. It is just a support layer.
March 25, 2026
Fine for a side read, especially when the chart is not clean. It can add noise if overused.

Diskussion

Häufig gestellte Fragen (FAQ)

BTCUSD
Forex
Signal
Indices
EURUSD
Commodities
GBPUSD
NZDUSD
Prop
Scalping
Crypto
Stocks
XAUUSD
NAS100
ATR
MACD
USDJPY
Über den cTrader Store verfügbare Produkte, einschließlich Handelsbots, Indikatoren und Plugins, werden von externen Entwicklern bereitgestellt und nur zu Informations- und technischen Zugriffszwecken verfügbar gemacht. cTrader Store ist kein Broker und erbringt keine Anlageberatung, persönlichen Empfehlungen oder eine Garantie für zukünftige Performance.

Mehr von diesem Autor

Indikator
AI
Prop
+8
The EMA Trend Simple is a trend-following tool designed for simplicity and visual clarity.
cBot
Prop Firm Fit
Stop Loss (SL) Manager
+1
HTS Strategy Tester - Advanced Multi-Timeframe Trend & Pullback Trading System H1/m1 & H4/m5 WWS 33/144 Start from 100$
90.1%
Rendite
2.92
Gewinnfaktor
Indikator
AI
Grid
+7
Follow The Trend cBot - INDICATOR - displays two Moving Average Bands for cBot or for your own use
Indikator
AI
SMC
+7
The ultimate tool for Price Action and ICT. High, Low and Mid levels for days, weeks Inc. NY Midnight and Custom Range.
Indikator
ATR
Prop
+13
HCCC MTF (Hurst Cycle Composite Channel), Designed for Semi-Automated Trading, Interactive MTF Dashboard
Indikator
AI
RSI
+7
EMA MTF TREND PRO - Multi-timeframe trend analysis overlay indicator, 6 timeframes - in one table with ADX
Indikator
Key Levels
TP_SL Very useful Risk & Reward Tool. Bring the ultimate TradingView-style Long/Short Position
Indikator
AI
SMC
+4
Weekly Daily Opening Gaps — NWOG & NDOG Indicator Professional-grade opening gap visualization for institutional traders
Indikator
AI
Prop
+7
EMA Clouds, Multi-Timeframe (MTF) Overlay, Swing High/Low detection, and a smart Dashboard with neutral zone filtering.
Indikator
ATR
Channel
+1
Bollinger Bands Advanced Squeeze & Breakout System, Real-Time On-Chart Dashboard, Auto-Squeeze Detector, Dual-Band Cloud
„RSI Advanced“-Logo
Beste Ratings
5.0
(4)
$20
/
$30
Indikator
AI
ATR
+12
The standard Relative Strength Index (RSI), RSI & Signal Cloud, Smart Volatility Filter (ATR), On-Chart Info Dashboard
Indikator
SMC
Prop
+11
Sessions PRO is a professional session visualization indicator - 4 Fully Customizable Sessions

Das könnte Sie auch noch interessieren

Indikator
Forex
BTCUSD
+5
Simple ICT Concepts
Indikator
Supertrend
Adaptive MA anchored to structural trend changes — no fixed period. Dual Supertrend + swing detection.
Indikator
AI
SMC
+5
Coloring trendline/ Colored Trendline / Color Trendline
Indikator
AI
ATR
+27
Market Cipher B
Indikator
ATR
Volume
+3
Fibonacci trend signals on closed bars, with an ATR stop, up to four targets and a break-even ladder.
Indikator
[Hamster-Coder] Pivot Points (Multi Time Frame)
Indikator
MSS
Key Levels
+2
Fractal based market structure indicator that identifies HH, HL, LH, and LL pivot with confirmed, non-repainting fractal
Indikator
ATR
RSI
+5
Supply and demand zones with break of structure, higher timeframe MA signals, a percent stop and three targets.
Indikator
RSI
Signal
+2
Dynamic circles visualize price's volatility position. Like RSI for market overextension & stretch. Quantify context.
Indikator
AI
Signal
+1
🔥 THIS BURNS JP225 INDICATOR – Professional Trading Signals
Indikator
SMC
Forex
+5
Pure Price Action ICT Tools
Indikator
Volume
Imbalance
+1
Volume profile indicator that auto-detects the latest trendline. Shows POC, Value Area (VAH/VAL), and High Volume Nodes
Indikator
Volume
Channel
+3
A higher-timeframe log-regression channel with a volume profile, Point of Control and session levels.
Indikator
ATR
Forex
+6
It combines swing (pivot-based) market structure detection with Gann Fan geometry and Fibonacci retracement/extension
Indikator
Signal
Scalping
Average accuracy of around 60% to 70% on 45min timeframes it is highly recommended to use stop losses
Indikator
Prop
Forex
+13
Volume Meter
„IVB 2.0“-Logo
Beste Ratings
4.6
(5)
$19
Indikator
IVB 2.0 is an indicator that works on the strategy of imbalance of the maximum volatility box of indices
„Vwap Bands“-Logo
Beste Ratings
4.5
(4)
$19
/
$29
Indikator
VWAP
Moving Average
Vwap Bands it is highly sought after by professional traders because it includes Standard Deviation Bands

Preis

30
Verkäufe
871
Kostenlose Installationen