
설명
Pinescriptlabs 스토어 지표: Pinescriptlabs 스토어 cBots : (cBot) Gold & BTC BreakoutSession Pivots(new)
고급 시장 구조: Bos, Choch, SwinLevels, 주문 블록, 시장 구조 및 유동성 탐색기 (New)
추적 스마트 알고리즘 (new)
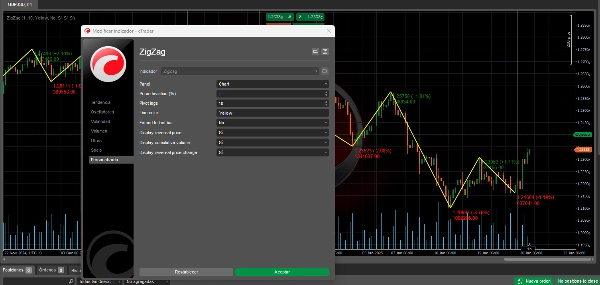
지그재그 지표: 시장 추세 단순화 📉📈
지그재그는 자산의 중요한 추세 변화를 식별하는 데 도움을 주는 기술적 지표로, 작은 시장 움직임을 걸러냅니다. 주요 목적은 작은 변동의 "노이즈"를 제거하여 시각적 가격 분석을 단순화하는 것입니다.
작동 원리 ⚙️
- 📊 가격을 분석하여 중요한 전환점(피벗)을 찾습니다.
- 📈 가격이 특정 최소 비율(편차 매개변수)만큼 변할 때 전환점이 중요하다고 간주됩니다.
- 🔗 이러한 전환점을 직선으로 연결하여 "지그재그" 패턴을 형성합니다.
- 🕒 새로운 가격 데이터가 나타날 때 동적으로 업데이트됩니다.
거래 유용성 💡
추세 식별 📐
- 🔍 주요 시장 방향을 시각화하는 데 도움을 줍니다.
- 🚀 강세 및 약세 추세를 쉽게 파악할 수 있습니다.
- 📏 주요 지지 및 저항 수준을 명확하게 강조합니다.
패턴 분석 📋
- 🎯 차트 패턴 식별을 단순화합니다.
- 🕵️♂️ 삼각형, 깃발 및 기타 패턴과 같은 가격 형성을 강조합니다.
- 🌊 엘리엇 파동 인식 시 명확성을 향상시킵니다.
거래 관리 🎛️
- 🎯 잠재적 진입 및 청산 지점을 식별합니다.
- 🛡️ 이전 피벗을 기반으로 손절매 수준을 결정하는 데 도움을 줍니다.
- 🎯 현실적인 가격 목표 설정을 용이하게 합니다.
변동성 분석 🌡️
- 📏 피벗 간 거리는 시장 변동성을 반영합니다.
- 🧩 움직임 크기에 따라 전략을 조정하는 데 도움을 줍니다.
- ⏳ 횡보 기간과 방향성 추세를 구분합니다.
신호 확인 ✅
- 🔍 다른 지표의 확인 도구로 사용됩니다.
- 🚪 주요 수준 돌파를 검증합니다.
- 🔗 더 강력한 전략을 위해 다른 지표와 결합할 수 있습니다.
주요 고려사항 🧠
회고적 특성 📅
- ⏪ 피벗 포인트는 움직임이 발생한 후에만 확인됩니다.
- 🔮 자체적으로는 예측적이지 않습니다.
- ⚖️ 의사결정을 위해 다른 지표와 함께 사용해야 합니다.
매개변수 조정 🔧
- 🎚️ 민감도는 설정된 편차 비율에 따라 달라집니다.
- 🔍 더 작은 비율은 더 많은 피벗 포인트를 보여줍니다.
- 🧹 더 높은 비율은 작은 움직임을 걸러내어 중요한 변화만 표시합니다.
시간 프레임 사용 🕒
- 🕰️ 모든 시간 프레임에서 작동합니다.
- 🔄 거래 기간에 따라 매개변수를 조정해야 합니다.
- 🌐 여러 시간 프레임을 분석하면 더 포괄적인 시각을 제공합니다.
📈 지그재그 지표를 강력한 도구로 활용하여 분석을 단순화하고, 추세를 식별하며, 거래 여정에서 의사결정을 향상시키세요! 🚀
요약
AI 요약
The ZigZag indicator is a technical analysis tool designed to identify significant trend changes by filtering out minor price fluctuations. It works by detecting key turning points (pivots) where price changes exceed a specified minimum percentage (deviation parameter). These pivots are connected with straight lines to form a zigzag pattern that updates dynamically with new price data.
Key functionalities include:
- Trend Identification: Visualizes primary market direction, highlights bullish and bearish trends, and marks key support and resistance levels.
- Pattern Analysis: Simplifies recognition of chart patterns such as triangles, flags, and Elliott waves.
- Trade Management: Assists in identifying entry and exit points, setting stop-loss levels based on previous pivots, and establishing realistic price targets.
- Volatility Analysis: Reflects market volatility through pivot distances, aiding strategy adjustments and distinguishing consolidation from trending phases.
- Signal Confirmation: Validates breakouts and complements other indicators for robust trading strategies.
The indicator is retrospective, confirming pivots only after price movements occur, and is not predictive on its own. Sensitivity can be adjusted via the deviation percentage to show more or fewer pivot points. It is compatible with any timeframe and benefits from multi-timeframe analysis for comprehensive market views.
This tool supports analysis across various markets including cryptocurrencies (BTCUSD), commodities (XAUUSD), and others, and integrates with related indicators like RSI, ATR, and Supertrend.
지표 프로필
고객 리뷰
4.3
리뷰: 6
5 | 50 % | |
4 | 33 % | |
3 | 17 % | |
2 | 0 % | |
1 | 0 % |
고객 리뷰
July 9, 2025
Pros: Simple and flexible settings, clear swing visualization, stable performance on major assets. Cons: No alerts or Fibonacci tools, lacks swing statistics, requires additional confirmation for trading decisions.
May 19, 2025
This just takes emotion away from trading. its great good work pal. i would also like to buy the source code from you.
상담
자주 묻는 질문(FAQ)
BTCUSD
Signal
Breakout
Supertrend
Commodities
RSI
Crypto
XAUUSD
ATR
트레이딩 봇, 지표, 플러그인 등 cTrader Store에서 제공되는 상품은 제3자 개발자에 의해 제공되며, 이는 단순히 정보 및 기술적 접근을 목적으로 제공된 것입니다. cTrader Store는 중개인이 아니며, 투자 조언, 개인별 추천 또는 향후 성과에 대한 어떠한 보장도 제공하지 않습니다.


가격
가입일 03/10/2024
163
판매
37.87K
무료 설치