
Описание
TP_SL Очень полезный инструмент Риск и Вознаграждение (в стиле TradingView)
Принесите лучший инструмент для позиций Long/Short в стиле TradingView прямо на ваши графики cTrader!
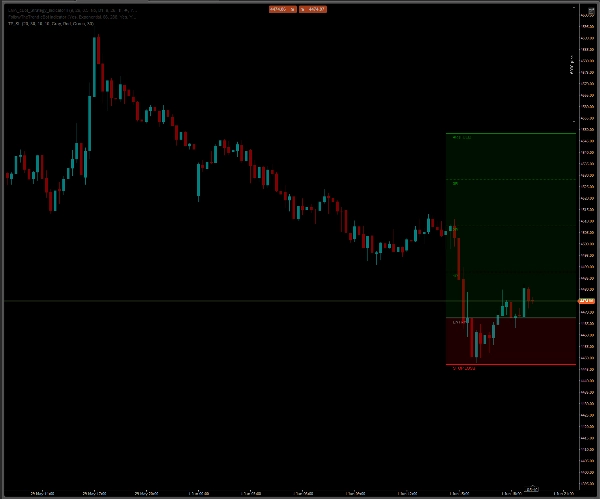
Если вы когда-либо искали быстрый, интуитивно понятный и интерактивный инструмент для рисования, чтобы планировать свои сделки, рассчитывать риск и визуально проецировать уровни Take Profit, этот индикатор для вас. Разработан для скорости и чистой эстетики графика, он позволяет создавать ваши торговые установки менее чем за секунду.
🔥 Ключевые особенности:
- Опыт TradingView в cTrader: Воспроизводит популярный визуальный инструмент для позиций Long/Short.
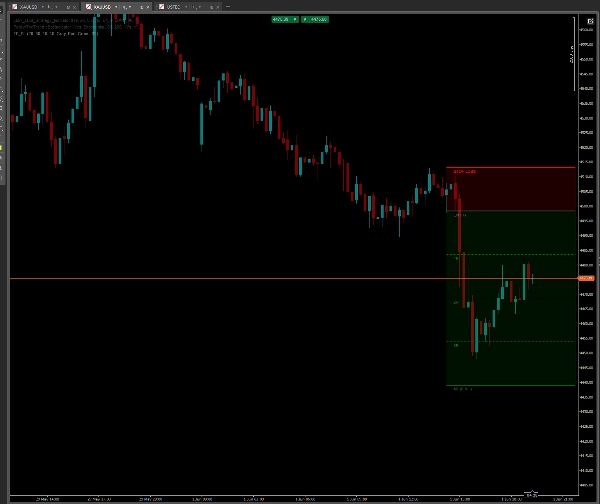
- Умный авто-переключатель (Long/Short): Плавно переключается между позициями Long и Short. Просто перетащите линию Stop Loss выше линии входа, и зоны Take Profit мгновенно перевернутся вниз.
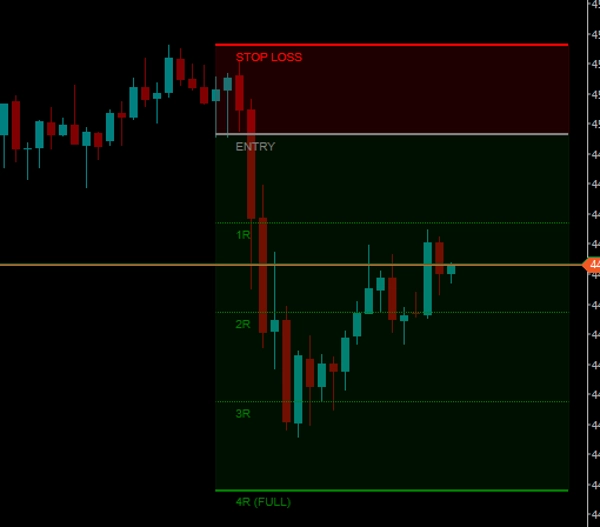
- Автоматические множители риска (R-математика): Автоматически рассчитывает ваш риск (1R) на основе расстояния между входом и Stop Loss, и динамически проецирует точные уровни Take Profit для 1R (безрисковый), 2R, 3R и 4R (полный TP).
- Технология чистого графика: В отличие от стандартных горизонтальных линий, которые бесконечно тянутся влево и загромождают ваши исторические данные, этот инструмент использует ограниченные линии. Он создает аккуратный, автономный блок, который остается именно там, где вам нужно.
- Динамическое отслеживание цены: По мере появления новых свечей инструмент автоматически "плавает" вправо, оставаясь близко к текущему движению цены.
⚡ Как использовать:
- Рисуйте: Удерживайте клавишу SHIFT и Левый клик в любом месте графика. Установка появится мгновенно.
- Настраивайте: Просто Перетащите серую линию "ENTRY" или красную линию "STOP LOSS" на желаемые уровни цены. Вся сетка рассчитывается и настраивается в реальном времени.
- Удаляйте: Кликните по линии входа или Stop Loss и нажмите клавишу Delete на клавиатуре. Индикатор имеет функцию автоматической очистки, которая мгновенно удалит весь рисунок, не оставляя беспорядка.
⚙️ Полностью настраиваемые параметры:
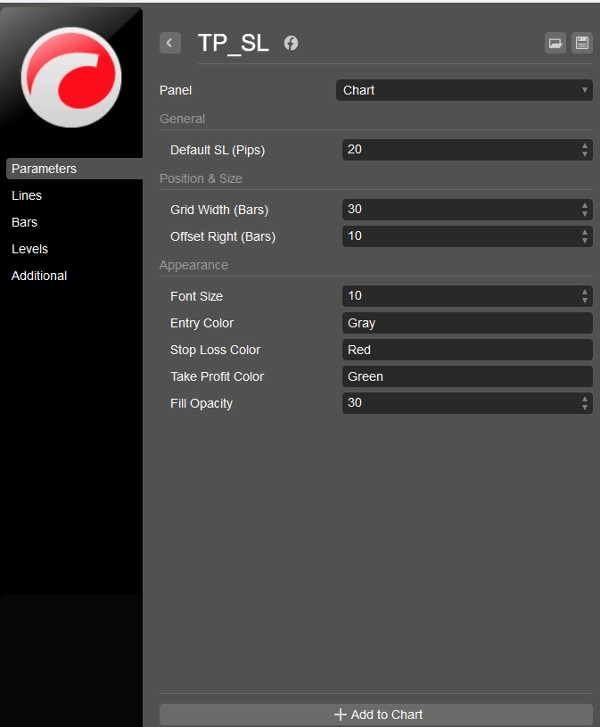
- Ширина и смещение сетки: Настройте длину инструмента (в барах) и насколько близко он расположен к текущей цене.
- Визуальные настройки: Полный контроль над цветами. Введите любое стандартное название цвета (например, DodgerBlue, Orange, Gray) для линий Entry, SL и TP.
- Прозрачность: Настройте прозрачность фоновых зон (от 0 до 255) для стильного, стеклянного вида.
- Размер текста: Сделайте подписи на графике идеально подходящими под разрешение вашего экрана.
Перестаньте гадать свои цели. Визуально планируйте сделки, соблюдайте управление рисками и держите графики идеально чистыми!
Этот индикатор полностью БЕСПЛАТЕН для сообщества cTrader.
Сводка
Key features include a smart auto-flip function that switches between long and short positions by dragging the stop loss line above or below the entry line, clean bounded lines that avoid cluttering historical data, and dynamic price tracking that keeps the tool aligned with current price action. Users can draw the setup by holding SHIFT and left-clicking, then adjust levels with drag-and-drop, and delete the drawing with a single key press.
The indicator offers full customization of grid width, offset, colors, opacity, and text size to fit individual chart preferences. It supports visualization on bar-based data and is categorized under pattern indicators with a focus on key levels. TP_SL aims to facilitate precise trade planning and risk management while maintaining clean chart aesthetics.