
Açıklama
🚀 10.000+ tüccar zaten en iyi göstergelerimizi🏆 kullanıyor
Profesyonellerin neden bizi seçtiğini keşfedin – en güçlü araçlar cTrader’da (göstergeler, algoritmalar ve cBotlar) sizi bekliyor.
👉 Tüm en iyi sistemlerimizi buradan edinin:
_______________________________________________
📌 Piyasa Yapısı Göstergeleri
· ✅ Gelişmiş Piyasa Yapısı: Bos, Choch, SwinLevels, Emir Blokları, Piyasa Yapısı& Likidite Bulucu
· 🔄 Dinamik Piyasa Yapısı Dönüş Noktalarının Analizi
· 🧱 Emir Bloğu
· ⚖️ Piyasa Dengesizliği
· ⛓️ BOS & CHOCH
· 🧠 ICT Gücü 3
_______________________________________________
🔚 Akıllı Çıkış Sistemleri
· 📍 Takip Eden Akıllı Algoritma
_______________________________________________
📐 ZigZag Göstergeleri
· 🔍 ZigZag Fiyat Likidite Projeksiyonu
· ➖ ZigZag
· 🎯 Zig-Zag Uç Nokta Takipçisi
_______________________________________________
🧱 Destek & Direnç Göstergeleri
· 🟩 SmartTrend Destek & Direnç Çizgileri
· 🧱 Tüm Destek ve Direnç Seviyeleri
_______________________________________________
📊 Trend & Kanal Göstergeleri
· 📊 Süpertrend
· 🧠 Uyarlanabilir Trend Kanalı
· 🔁 Reaktif Hareketli Ortalama
_______________________________________________
💧 Hacim & Likidite Araçları
· 🔍 Momentum Adil Değer Boşluğu
· 🕒 Adil Değer Boşluğu Seansları
_______________________________________________
⚡ Momentum & RSI Göstergeleri
· 🔎 Çok Katmanlı Mum Eğilimi
Takipçisi
_______________________________________________
🔮 Tahmin & Projeksiyon Araçları
· 📐 Linreg & ATR’ye Dayalı Tahmin
· 📏 Fibonacci Doğrusal Regresyon Çoklu Zaman Dilimi
· 📈 Hacim Destekli Piyasa Akışı Projeksiyonu
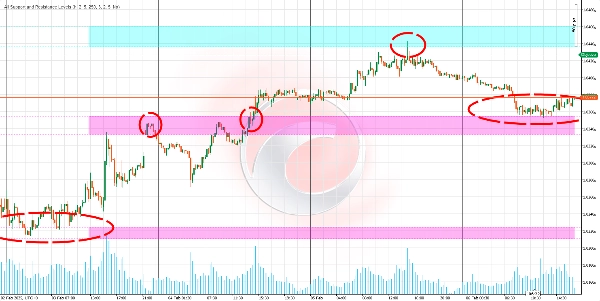
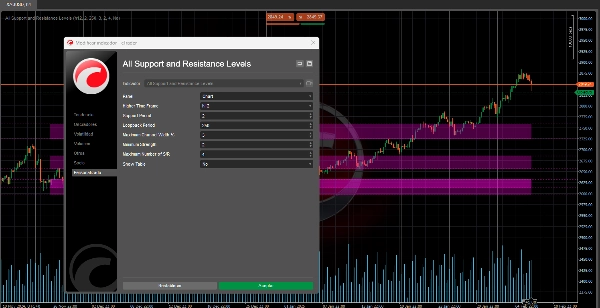
Bu algoritma, piyasadaki önemli seviyeleri belirlemenize yardımcı olmak için tasarlanmış gelişmiş bir destek ve direnç göstergesidir.
Ana avantajı, destek ve direnç seviyelerini herhangi bir zaman diliminden (günlük, haftalık veya aylık gibi) analiz ettiğiniz grafik üzerinde, farklı bir zaman diliminde bile olsa (örneğin 15 dakika veya 1 saat) doğrudan görüntüleyebilmenizi sağlamasıdır. 📊⏰
Ne işe yarar? 🎯
Önemli piyasa bölgelerini belirleyin:
- Fiyatın durabileceği, sıçrayabileceği veya güçlü bir şekilde kırabileceği seviyeleri tespit edin. 🛑↗️↘️
- Giriş, çıkış ve stop-loss kararlarınızı daha bilinçli yapmanıza yardımcı olur. 💡📈📉
Grafikler arasında geçiş yapmadan çoklu zaman dilimlerini analiz edin:
- Daha yüksek zaman dilimlerinden (günlük veya haftalık gibi) önemli seviyeleri, daha düşük zaman dilimlerinde (15 dakika veya 1 saat gibi) işlem yaparken görün. 🕒📅
- Sürekli grafik değiştirmeden daha geniş bir piyasa görünümü sağlar. 🌍🔍
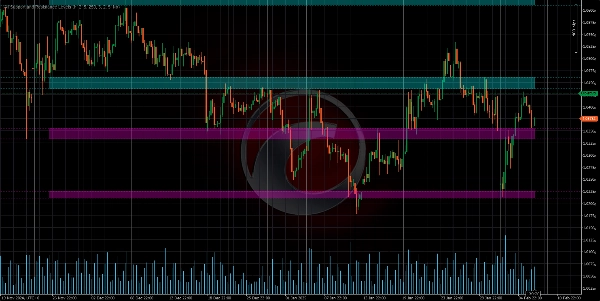
Önemli seviyelere öncelik verin:
- Gösterge, destek ve direnç seviyelerini "güç"lerine göre sıralar; yani fiyatın geçmişte bu seviyelerle ne sıklıkta etkileşime girdiğine göre. 💪📊
- Bu, en alakalı ve güvenilir seviyelere odaklanmanıza yardımcı olur. 🎯✅
Mantık nasıl çalışır? 🧠⚙️
Veri Toplama:
- Gösterge, belirli bir zaman diliminden (günlük, haftalık vb.) yüksek ve düşük fiyatları alır. 📈📉
- Bu veriler, fiyat davranışındaki önemli kalıpları aramak için kullanılır. 🔍📊
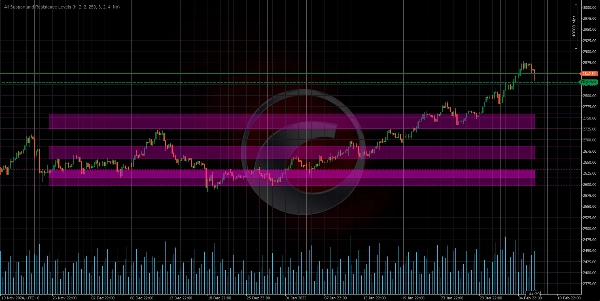
Ana noktaların (pivotların) tespiti:
- Fiyatın çevresindeki fiyatlara göre zirve veya dip yaptığı yerel yüksek ve düşük noktaları belirler. ⛰️🌄
- Bu noktalar destek veya direnç seviyeleri olma adaylarıdır. 🎯📌
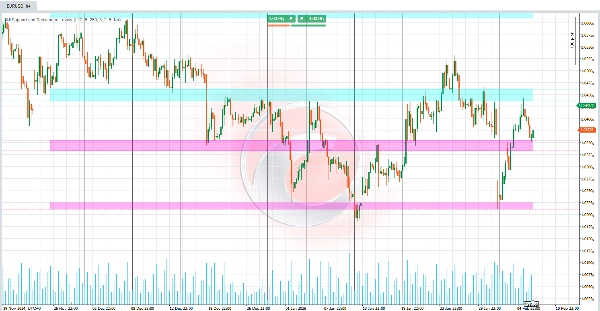
Seviyelerin gruplanması:
- Yakın seviyeler, kesin çizgiler yerine destek veya direnç bölgeleri oluşturmak için gruplanır. 🟦🟧
- Bu, destek ve direncin alanlar olduğunu, kesin noktalar olmadığını yansıtır. 📏🎯
Seviye güç hesaplaması:
Bir seviyenin "gücü" iki faktöre bağlıdır:
- Dokunma sıklığı: Fiyatın geçmişte o seviyeye kaç kez dokunduğu veya yaklaştığı. 🔄📊
- Ana noktaların kümelenmesi: O seviyeye yakın kaç yüksek veya düşük nokta olduğu. 🔗📈
Daha yüksek güçteki seviyeler daha önemli kabul edilir. 💪🎯
Grafik görselleştirmesi:
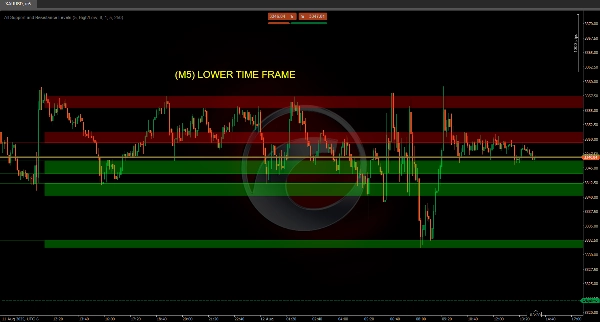
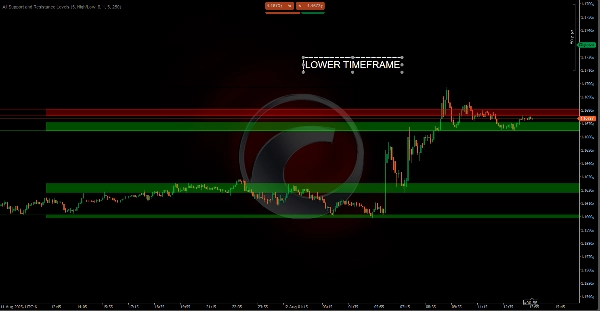
- Seviyeler grafik üzerinde yatay çizgiler veya renkli bölgeler olarak çizilir. 🎨📊
- Her seviyenin rengi mevcut fiyat konumuna bağlıdır:
-
- Direnç: Fiyat seviyenin altındaysa. 🔴
- Destek: Fiyat seviyenin üstündeyse. 🟢
- Aralık içinde: Fiyat seviyenin aralığı içindeyse. 🟡
Grafiğinizde farklı zaman dilimlerini nasıl görüntüleyebilirsiniz? 🕒📊
Daha yüksek zaman dilimlerinden daha düşük zaman dilimi grafiklerinde destek ve direnç:
- Örneğin, 15 dakikalık bir grafik analiz ediyorsanız, gösterge günlük veya haftalık zaman diliminden önemli seviyeleri gösterebilir. 🕒📅
- Bu, mevcut grafiğinizi terk etmeden önemli daha yüksek bağlam seviyelerini görmenizi sağlar. 🌍🔍
Daha düşük zaman dilimlerinden daha yüksek zaman dilimi grafiklerinde destek ve direnç:
- Daha az yaygın olmakla birlikte, daha küçük zaman dilimlerinden (örneğin 1 dakika veya 5 dakika) seviyeleri daha yüksek zaman dilimi grafiklerinde (günlük veya haftalık gibi) görüntüleyebilirsiniz. 🕒📅
- Bu, daha geniş bir bağlam içinde daha detaylı analiz için faydalı olabilir. 🔍📊
Özet
The indicator analyzes price data by collecting highs and lows from specified timeframes, identifying local pivot points where price peaks or valleys occur. These points are grouped into zones representing support or resistance areas rather than precise lines. Each level is assigned a strength score based on the frequency of price touches and the clustering of key points, helping users prioritize the most significant and reliable levels.
Visualized on the chart as horizontal lines or colored zones, the indicator uses color coding to indicate the price's position relative to each level: red for resistance (price below level), green for support (price above level), and yellow when price is within the level’s range. This tool assists traders in making informed decisions on entries, exits, and stop-loss placements by highlighting where price may stop, bounce, or break with strength.
Müşteri değerlendirmeleri
5 | 50 % | |
4 | 0 % | |
3 | 0 % | |
2 | 0 % | |
1 | 50 % |


