
Candles_Painter
Gösterge
3 satın almalar
Sürüm 1.0, Aug 2025
Windows, Mac
5.0
Değerlendirmeler: 2
Başlangıç 26/05/2025
388.58M
İşlem hacmi
60.75K
Kazanılan pip
15
Satışlar
1.41K
Ücretsiz yüklemeler
Açıklama
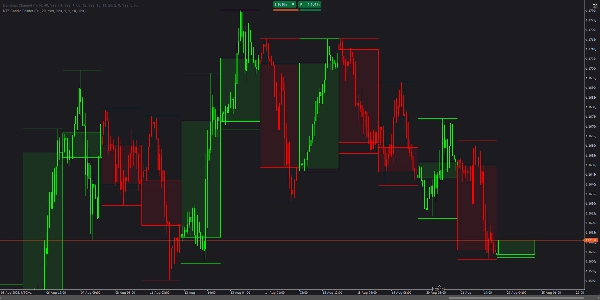
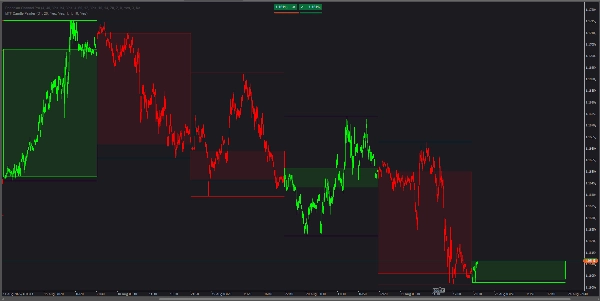
MTF Candle Painter mevcut grafiğinizde doğrudan daha yüksek zaman dilimi (HTF) bağlamını bindirir. Aktif zaman dilimindeki her çubuğu çevreleyen HTF mumunun yönüne göre renklendirir ve doldurulmuş bir HTF gövde dikdörtgeni (sadece açılış-kapanış, fitil yok) ile isteğe bağlı HTF Yüksek/Düşük çizgileri çizer. Ayrı boğa/ayı renkleri ve ayarlanabilir dolgu opaklığı, bir bakışta temiz ve okunabilir bir eğilim sunar.
Ana Özellikler
- Çok zaman dilimli çubuk renklendirme: bir HTF mumunun içindeki tüm çubuklar, onun boğa/ayı rengini miras alır.
- HTF gövde bindirmesi: HTF açılış ve kapanış arasındaki dikdörtgen; netlik için orta fitil yok.
- Ayrı boğa/ayı stili: boğa ve ayı HTF mumları için bağımsız kontur ve dolgu renkleri.
- Ayarlanabilir opaklık: fiyatla düzgün üst üste binme için dolgu şeffaflığını ayarlayın (varsayılan %10).
- HTF Yüksek/Düşük çizgileri: isteğe bağlı, kalınlığı yapılandırılabilir.
- Geriye dönük kontrol: kaç tane son HTF mumunun çizileceğini seçin (varsayılan 20).
- Hafif: yerel grafik nesnelerini kullanır; hızlı ve müdahalesiz.
Parametreler
Temel
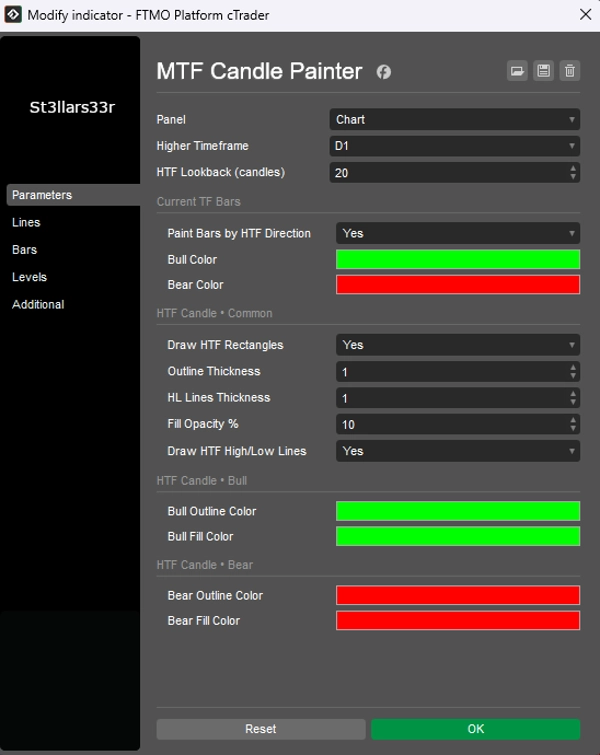
Daha Yüksek Zaman Dilimi– bindirilecek HTF (örneğin, D1, H4, W1).HTF Geriye Dönük (mumlar)– kaç HTF mumunun çizileceği (varsayılan 20).
Mevcut Zaman Dilimi Çubukları
HTF Yönüne Göre Çubukları Boya– mevcut zaman dilimi çubuklarını çevreleyen HTF mumuna göre renklendir (Evet/Hayır).Boğa Rengi/Ayı Rengi– mevcut zaman dilimi çubukları için renkler.
HTF Mum • Genel
HTF Dikdörtgenlerini Çiz– HTF gövde dikdörtgenlerini göster (varsayılan Evet).Kontur Kalınlığı– HTF gövde kontur kalınlığı.HL Çizgileri Kalınlığı– HTF Yüksek/Düşük çizgilerinin kalınlığı.Dolgu Opaklığı %– HTF gövde dolgusunun şeffaflığı (varsayılan %10).HTF Yüksek/Düşük Çizgilerini Çiz– HTF Yüksek/Düşük çizgilerini aç/kapa (Evet/Hayır).
HTF Mum • Boğa
Boğa Kontur Rengi– boğa HTF mumları için kontur rengi.Boğa Dolgu Rengi– boğa HTF mumları için dolgu rengi.
HTF Mum • Ayı
Ayı Kontur Rengi– ayı HTF mumları için kontur rengi.Ayı Dolgu Rengi– ayı HTF mumları için dolgu rengi.
Kimler İçin
- Grafik değiştirmeden sürekli HTF eğilimine ihtiyaç duyan gün içi traderlar ve scalperlar.
- SMC/Wyckoff uygulayıcıları daha düşük zaman dilimlerinde işlem yaparken daha yüksek zaman dilimi yapısına güvenenler.
- Çalışma zaman dilimlerinde temiz, görsel HTF bağlamı isteyen herkes.
Özet
YZ özeti
Candles_Painter is a multi-timeframe indicator designed to overlay higher timeframe (HTF) candle context onto a lower timeframe chart. It visually colors each bar on the active timeframe according to the bullish or bearish direction of the enclosing HTF candle. The indicator draws filled rectangles representing the HTF candle bodies (open to close, excluding wicks) with customizable fill opacity and separate colors for bullish and bearish candles. Optional HTF high and low lines can also be displayed with adjustable thickness.
Key features include:
- Coloring of all bars within an HTF candle by its direction.
- HTF body overlays for clear visual bias.
- Independent styling for bullish and bearish HTF candles.
- Adjustable transparency for neat integration with price data.
- Configurable lookback period for the number of HTF candles shown.
- Lightweight implementation using native chart objects for performance.
Users can customize parameters such as the higher timeframe to overlay (e.g., daily, 4-hour), colors for bars and HTF candles, opacity, and whether to display HTF high/low lines. This tool is suited for intraday traders, scalpers, and market structure practitioners who require continuous HTF context without switching charts.
Gösterge profili
Müşteri değerlendirmeleri
5.0
Değerlendirmeler: 2
5 | 100 % | |
4 | 0 % | |
3 | 0 % | |
2 | 0 % | |
1 | 0 % |
Müşteri değerlendirmeleri
September 1, 2025
The log becomes easier to read, but a manual check is still part of the process.
August 27, 2025
A few ugly trades are useful in the sample, and it makes the setup easier to question.
Tartışma
SSS
cTrader Store üzerinden erişilebilen işlem botları, göstergeler ve eklentiler gibi ürünler, üçüncü taraf sağlayıcılar tarafından sağlanır ve yalnızca bilgilendirme ve teknik erişim amaçlarıyla sunulur. cTrader Store bir broker değildir ve yatırım tavsiyesi, kişisel öneriler vermez veya gelecekteki performansı garanti etmez.


!["[Stellar Strategies] Inside Bar with Signals" logosu](https://cdn.ctrader.com/image/webp/1d9e8bfa-3b2c-4440-bb37-5856902008a7_30683)


Fiyat
Başlangıç 26/05/2025
388.58M
İşlem hacmi
60.75K
Kazanılan pip
15
Satışlar
1.41K
Ücretsiz yüklemeler