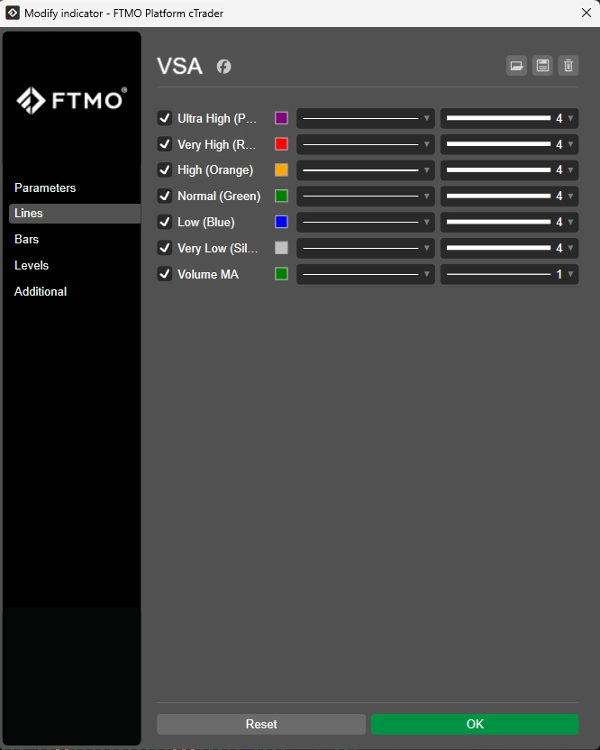
Açıklama
Üç farklı analiz moduna sahip gelişmiş, çok modlu bir hacim göstergesi. Ticaret tarzınıza uyacak şekilde anında modlar arasında geçiş yapın.
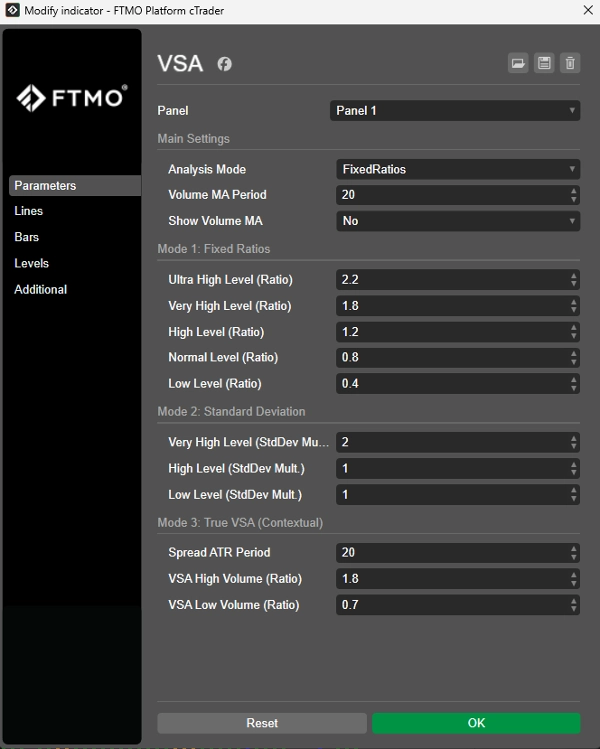
Mod 1: Sabit Oranlar
Hacmi, hareketli ortalaması ile çarpılan sabit, kullanıcı tanımlı oranlarla karşılaştırarak kategorize eder (örneğin, "Yüksek" için 2,0x).
En iyisi: Manuel kontrolü ve sabit eşikleri tercih eden tüccarlar için.
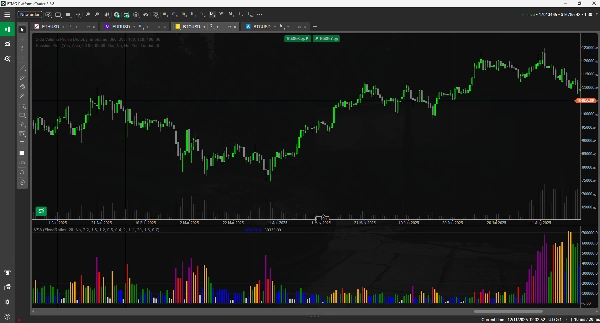
Mod 2: Standart Sapma (Uyarlanabilir)
Bu mod piyasa volatilitesine otomatik olarak uyum sağlar. Hacmi, ortalamadan (hareketli ortalama) kaç standart sapma uzaklıkta olduğuna göre kategorize eder.
En iyisi: Herhangi bir enstrüman veya zaman diliminde "kutudan çıkar çıkmaz" çalışan uyarlanabilir bir araç.
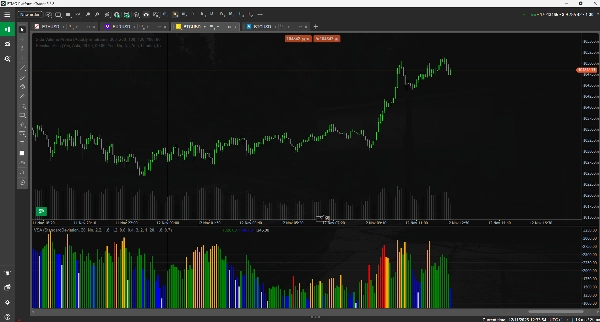
Mod 3: Gerçek VSA (Bağlamsal)
Klasik, profesyonel yaklaşım. Bu mod, anahtar sinyalleri tanımlamak için Hacim + Yayılım (Aralık) + Kapanış Pozisyonunu birleştirerek barın bağlamını analiz eder.
Özet
1. Fixed Ratios mode categorizes volume by comparing it to a moving average multiplied by user-defined fixed ratios, providing manual control over volume thresholds.
2. Standard Deviation mode adapts automatically to market volatility by classifying volume based on its deviation from the moving average, suitable for use across various instruments and timeframes without manual adjustment.
3. True VSA (Contextual) mode applies a professional volume spread analysis by evaluating volume in conjunction with bar range and close position to identify key market signals.
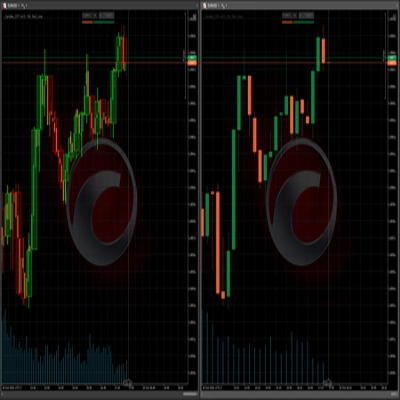
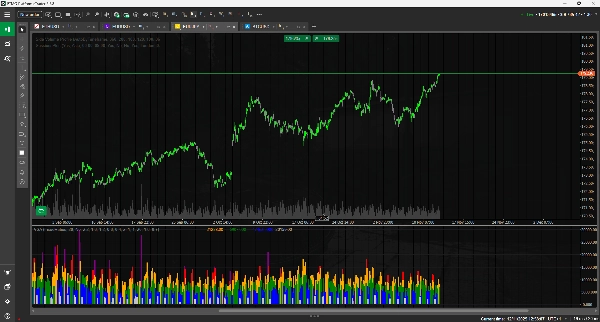
This multi-mode indicator supports a wide range of markets including Forex, cryptocurrencies (e.g., BTCUSD, ETH), commodities (e.g., gold, oil), indices (e.g., NAS100, SP500), and stocks. It enables traders to switch instantly between modes to align with their preferred analysis style and trading strategy.
Müşteri değerlendirmeleri
5 | 100 % | |
4 | 0 % | |
3 | 0 % | |
2 | 0 % | |
1 | 0 % |