
ScalperSignalVisual
Chỉ báo
191 lượt tải
Phiên bản 1.0, Aug 2025
Windows, Mac
Mô tả
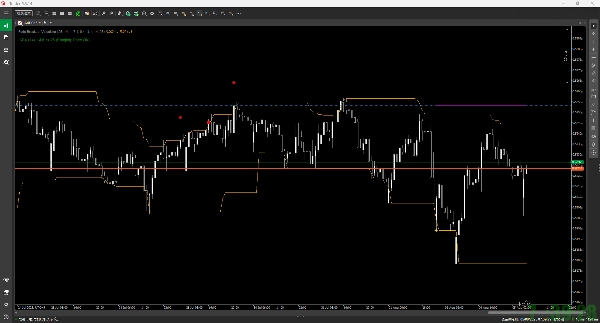
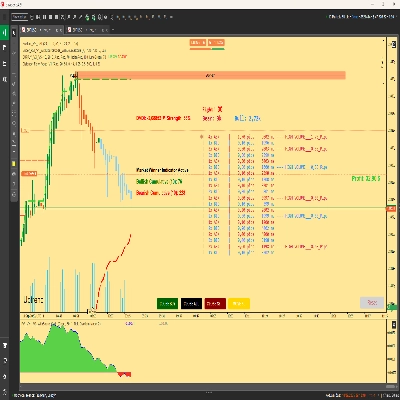
Chỉ báo này là một công cụ để trực quan hóa logic giao dịch của một chiến lược ngược chiều gọi là "Fade Breakout" trên biểu đồ của bạn. Nó không thực hiện các giao dịch thực tế mà chỉ hiển thị cách một vị thế sẽ được quản lý từ lúc vào lệnh đến khi thoát lệnh khi có tín hiệu xảy ra.
Các tính năng chính
- Tín hiệu vào lệnh:
-
- Nó sử dụng Kênh Donchian.
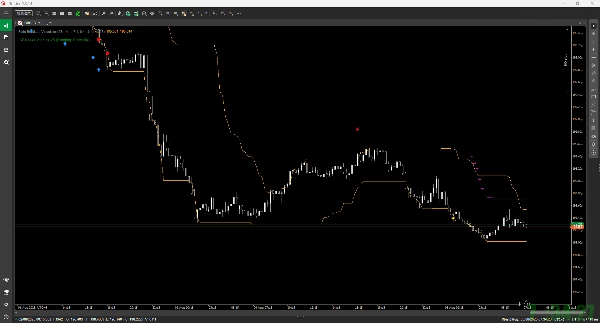
- Tín hiệu mua (Ngược chiều): Khi giá phá xuống dưới dải dưới của Kênh Donchian, nó hiển thị tín hiệu mua (mũi tên lên màu xanh ↑).
- Tín hiệu bán (Ngược chiều): Khi giá phá lên trên dải trên của Kênh Donchian, nó hiển thị tín hiệu bán (mũi tên xuống màu đỏ ↓).
- Quản lý rủi ro:
-
- Khi vào lệnh, một mức Cắt lỗ ban đầu (đường chấm đỏ) và một mức Chốt lời đầu tiên (đường chấm xanh lá) được vẽ dựa trên ATR (Average True Range).
- Khi mức Chốt lời đầu tiên (TP1) được chạm, một ngôi sao vàng (★) xuất hiện, và mức cắt lỗ được di chuyển về giá vào lệnh (điểm hòa vốn).
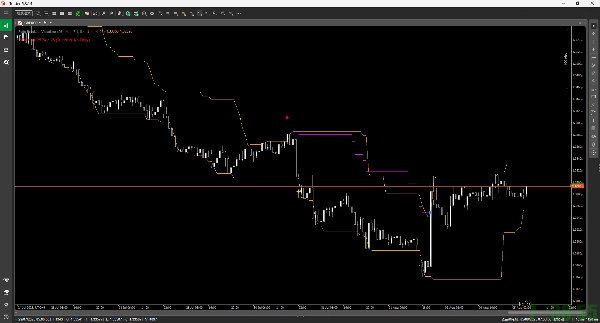
- Sau đó, một Trailing Stop dựa trên ATR được kích hoạt để bảo vệ lợi nhuận bằng cách theo dõi giá. Đường đi của trailing stop được hiển thị dưới dạng đường màu tím.
- Thoát lệnh:
-
- Cắt lỗ: Nếu giá chạm mức cắt lỗ, nó được đánh dấu bằng một hình vuông đỏ (■).
- Thoát trailing stop: Nếu giá chạm trailing stop, nó được đánh dấu bằng một hình vuông màu xanh dương (■).
- Bộ lọc ADX:
-
- Bạn có thể tùy chọn bật bộ lọc ADX.
- Nếu ADX cao hơn một giá trị xác định (cho thấy xu hướng mạnh), nó sẽ vô hiệu hóa các tín hiệu vào lệnh mới. Trạng thái hiện tại (Entry OK / No Entry) được hiển thị ở góc trên bên trái của biểu đồ.
Tóm tắt
Hồ sơ chỉ báo
Đánh giá của khách hàng
0.0
Đánh giá: 0
Đánh giá của khách hàng
Sản phẩm này chưa có đánh giá nào. Bạn đã dùng thử chưa? Hãy là người đầu tiên chia sẻ với mọi người!
Thảo luận
Câu hỏi thường gặp
Các sản phẩm có sẵn trên cTrader Store, bao gồm bot giao dịch, chỉ báo và plugin, được cung cấp bởi các nhà phát triển bên thứ ba và chỉ nhằm mục đích cung cấp thông tin và tiếp cận kỹ thuật. cTrader Store không phải là nhà môi giới và không cung cấp lời khuyên đầu tư, khuyến nghị cá nhân hay bất kỳ đảm bảo nào về hiệu suất trong tương lai.
Sản phẩm khác của tác giả này


Giá
1
Lượt bán
1.34K
Cài đặt miễn phí