

AI Supertrend MTF
Indikator
3 pembelian
Versi 1.0, Jul 2026
Windows, Mac

534.4M
Volume trading
9.76M
Pip dimenangkan
4
Penjualan
Deskripsi
Ikhtisar:
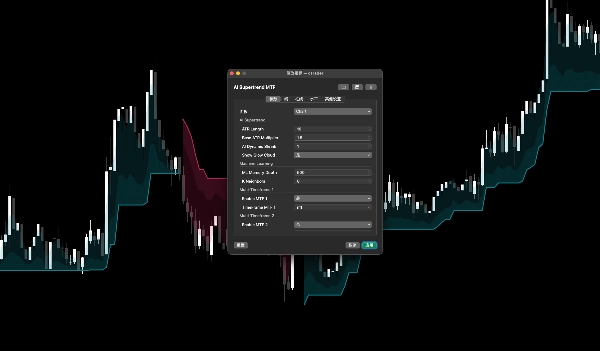
Lelah dengan indikator Supertrend tradisional yang tertinggal dari perubahan pasar yang tiba-tiba? AI Supertrend MTF mendefinisikan ulang mengikuti tren dengan mengintegrasikan algoritma Pembelajaran Mesin K-Nearest Neighbors (K-NN). Ini terus belajar dari aksi harga terbaru (RSI, ATR, Momentum) dan secara otomatis menyesuaikan sensitivitasnya untuk menghilangkan sinyal palsu di pasar yang bergejolak sambil menangkap breakout besar secara instan.
Fitur Utama:
- 🤖 Mesin Pembelajaran Mesin: Memanfaatkan bank memori yang berkembang dan pembobotan fitur dinamis untuk membedakan antara tren nyata dan kebisingan pasar.
- 📊 Proyeksi Multi-Timeframe (MTF): Lihat gambaran yang lebih besar! Proyeksikan hingga DUA timeframe yang lebih tinggi (misalnya, 1H dan Harian) langsung ke grafik timeframe rendah Anda saat ini. Dirancang dengan logika bitwise yang ketat untuk menjamin NOL repainting dan tanpa kebocoran data masa depan.
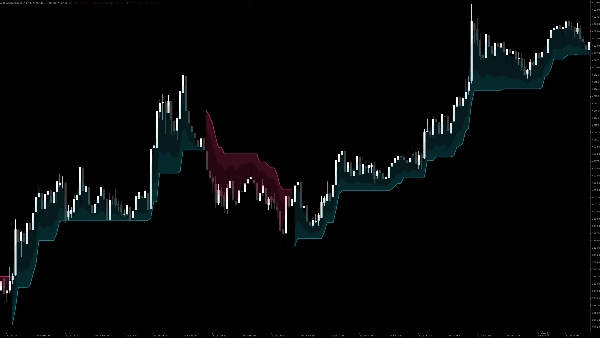
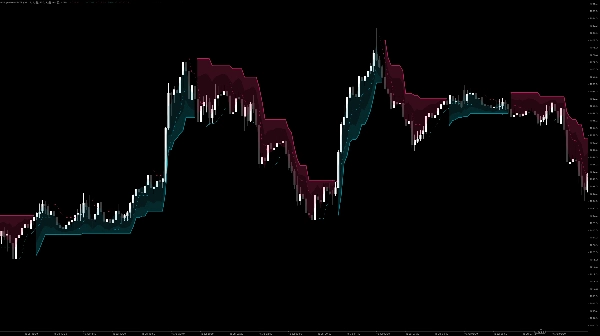
- ✨ Awan Bersinar Dinamis: Peningkatan visual yang menakjubkan. Menampilkan awan gradasi 3 lapis yang halus dan tidak mengganggu untuk menunjukkan secara visual kekuatan dan zona support/resistance dari tren saat ini.
- ⚙️ Sangat Dapat Disesuaikan: Sesuaikan Kedalaman Memori AI, K-Tetangga, dan granularitas MTF langsung dari panel parameter asli cTrader.
Cara Menggunakan (Manual Pengguna):
- Pasang ke Grafik: Terapkan indikator ke timeframe favorit Anda. Garis tren utama akan segera menampilkan arah yang dihitung AI saat ini.
- Aktifkan MTF (Opsional): Gulir ke bawah di pengaturan ke
Multi-Timeframe 1danMulti-Timeframe 2. Centang kotak "Enable" dan pilih timeframe lebih tinggi yang Anda inginkan. Garis putus-putus akan muncul, menunjukkan tren makro. - Strategi Trading:
-
- Sinyal Beli: Ketika garis tren utama berubah menjadi Cyan (di bawah harga) DAN garis timeframe lebih tinggi MTF juga Cyan (Penyesuaian Tren).
- Sinyal Jual: Ketika garis tren utama berubah menjadi Merah (di atas harga) DAN garis timeframe lebih tinggi MTF juga Merah.
- Keluar: Gunakan pita awan bersinar sebagai level trailing stop-loss dinamis.
Ringkasan
AI summary
AI Supertrend MTF is a trend-following indicator that integrates a K-Nearest Neighbors (K-NN) machine learning algorithm to reduce lag and false signals typical of traditional Supertrend indicators. It continuously learns from recent price action metrics including RSI, ATR, and momentum, adapting its sensitivity to distinguish true trends from market noise and to capture breakouts promptly.
Key features include multi-timeframe (MTF) projection, allowing users to overlay trend information from up to two higher timeframes onto the current chart without repainting or future data leaks. The indicator visually represents trend strength and support/resistance zones through dynamic, three-layer glowing clouds. Users can customize AI memory depth, K-neighbors, and MTF settings via the native parameter panel.
To use, apply the indicator to any timeframe to see the AI-calculated trend direction. Optional MTF lines display macro trends from higher timeframes. Buy and sell signals are generated when the main trendline and MTF lines align in color (cyan for buy, red for sell). The glowing cloud bands serve as dynamic trailing stop-loss levels.
This indicator supports visualization, signals, and filtering functions, and requires bar, tick, and volume data inputs. It is categorized under trend indicators and incorporates RSI and ATR for momentum and volatility analysis.
Key features include multi-timeframe (MTF) projection, allowing users to overlay trend information from up to two higher timeframes onto the current chart without repainting or future data leaks. The indicator visually represents trend strength and support/resistance zones through dynamic, three-layer glowing clouds. Users can customize AI memory depth, K-neighbors, and MTF settings via the native parameter panel.
To use, apply the indicator to any timeframe to see the AI-calculated trend direction. Optional MTF lines display macro trends from higher timeframes. Buy and sell signals are generated when the main trendline and MTF lines align in color (cyan for buy, red for sell). The glowing cloud bands serve as dynamic trailing stop-loss levels.
This indicator supports visualization, signals, and filtering functions, and requires bar, tick, and volume data inputs. It is categorized under trend indicators and incorporates RSI and ATR for momentum and volatility analysis.
Profil indikator
Kategori indikator
Tren
Tipe output
Visualisasi
Filter
Sinyal
Persyaratan data
Hanya batang
Data tick
Volume
Sinyal yang didukung
Cross
Breakout
Reversal
Kekuatan tren
Volatilitas
Level tertembus
Ulasan pelanggan
0.0
Ulasan: 0
Ulasan pelanggan
Belum ada ulasan untuk produk ini. Sudah mencobanya? Jadilah pemberi ulasan pertama!
Diskusi
Pertanyaan umum
Supertrend
RSI
ATR
Produk-produk yang tersedia melalui cTrader Store, termasuk bot trading, indikator, dan plugin, disediakan oleh pengembang pihak ketiga serta hanya ditujukan untuk akses teknis dan informasi. cTrader Store bukan broker dan tidak menyediakan saran investasi, rekomendasi pribadi, atau jaminan apa pun tentang kinerja di masa mendatang.
Produk lain dari penulis ini






















Harga
534.4M
Volume trading
9.76M
Pip dimenangkan
4
Penjualan