Brokers & props
For business
00
Days
:
00
Hours
:
00
Minutes
:
00
Seconds
Indicator
NAS100
NZDUSD
Breakout
XAUUSD
FVG
Commodities
Forex
Signal
EURUSD
GBPUSD
BTCUSD
SMC
VWAP
ZigZag
Indices
Prop
ATR
Stocks
Supertrend
Crypto
USDJPY
Scalping
Session Plus HL
19/11/2025
1
Desktop
Since 26/05/2025
Traded volume
266.33M
Pips won
35.4K
Sales
10
Free installs
513
"Session Plus HL" uploaded image"Session Plus HL" uploaded image"Session Plus HL" uploaded image"Session Plus HL" uploaded image"Session Plus HL" uploaded image"Session Plus HL" uploaded image"Session Plus HL" uploaded image

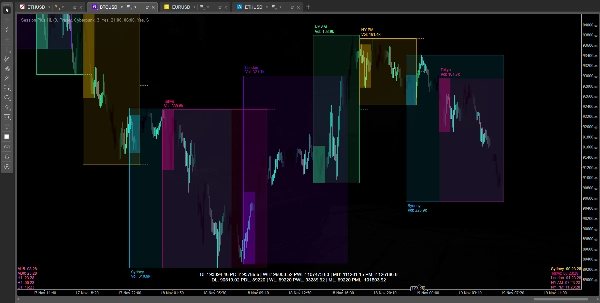
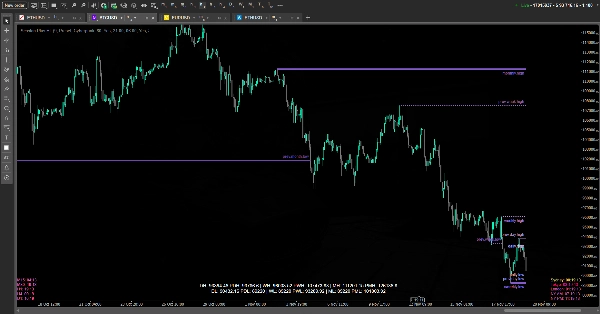
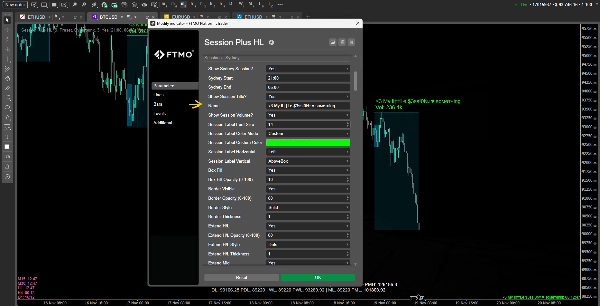
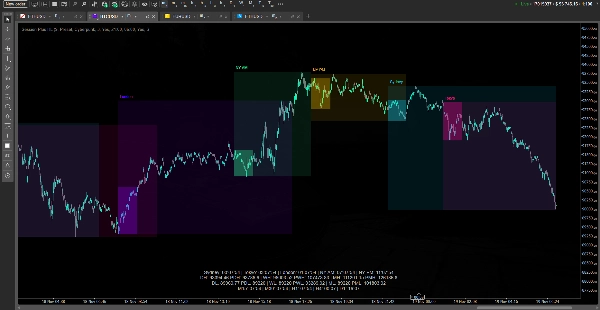
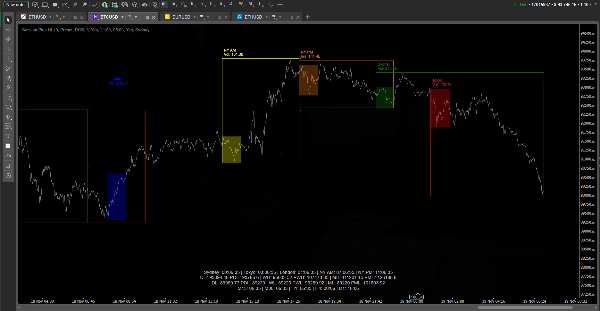
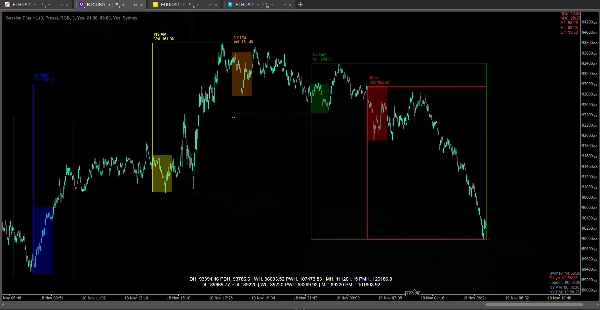
This indicator is designed to visualize market structure and time-based context for intraday traders. It automatically plots key trading sessions (Sydney, Tokyo, London, New York AM/PM) as boxes on the chart, shows their high/low and optional mid levels, and can highlight an Initial Balance (IB) range inside each session. It also draws key reference levels from higher timeframes — current and previous day/week/month highs and lows — and displays them both as lines on the chart and as a compact dashboard, so you always see where price is relative to recent liquidity pools.

On top of that, the indicator provides several HUDs: a session dashboard showing how long remains until each session opens or closes, a key levels dashboard summarizing all daily/weekly/monthly H/L values, and a candle dashboard that shows time remaining in candles on multiple higher timeframes and their bullish/bearish state. All visuals are theme‑able (color presets or custom colors), can be tuned for performance (hiding sessions on higher TFs, controlling line stubs instead of heavy dynamic extensions), and are meant to support analysis of liquidity sweeps, session ranges, and timing without cluttering or slowing the chart.

0.0
Reviews: 0
Customer reviews
No reviews for this product yet. Already tried it? Be the first to tell others!
More from this author
Indicator
NAS100
Indices
Prop
+6
VolumeThermometer
Heatmap of intra-HTF volume (POC/VA) built from LTF tick data; paints current candle and auto-loads visible history.
Side Volume Profile
Right-anchored cTrader Volume Profile with VAH/VAL/POC, LVZ, top volume+EMA, themes, and fast, readable visuals.
Indicator
ZigZag
VWAP
FVG
+4
Candle Volume Profile Demo
Candle Volume Profile for Crypto
Candles_Painter
Overlay HTF context on any chart: color bars by HTF and draw filled HTF bodies with optional High/Low lines.
Indicator
NAS100
NZDUSD
XAUUSD
+12
VSA
Pro VSA tool with 3 modes: Fixed Ratios, Standard Deviation & Contextual VSA.
Indicator
NAS100
NZDUSD
XAUUSD
+14
Donchian Channel Pro
Tracks N-period highs/lows, HTF overlay, HUDs with ADX, RSI, session clocks. Customizable for precise trading.
Moving Average Plus
10 configurable moving averages: choose type, period, color per line; single price source for all.
TrendStrengthSignals
Edge-aware clouds + Pro HUD: better entries, calmer exits, adaptive risk.
Market Entropy
Market entropy + DC. Spot crystallization/chaos shifts with an optional on-chart overlay.
Indicator
NAS100
NZDUSD
XAUUSD
+16
Candle Timer Toolbox
A multi-TF panel with candle timers, sessions, ticker, spread & 15+ themes. Fully customizable.
You may also like
Indicator
Indices
Stocks
Forex
+4
MACD Pro Trader
🚀 MACD Pro Trader – Advanced MACD with buy/sell signals, custom MAs & color-coded histograms for smarter trading! 📈🔥
Indicator
Indices
Prop
Commodities
+3
HMA MTF 2.0
HMA MTF 2.0 (Multi-Timeframe )
Indicator
Grid
NAS100
NZDUSD
+16
Frac Support Resistance V1
Smart Support/Resistance lines auto calculated from D1/H4/H1/M15. Highly customizable visuals + built in Backtest Mode.
Indicator
Breakout
ORB v1
Opening Range Breakout (ORB) - Visual Edition
Indicator
Indices
Prop
Commodities
+4
TrendPulse
BrickAlgo TrendPulse is an advanced technical analysis tool that combines multiple indicators with filterin mechanisms.
Daily Open Pivot Level
This indicator is a valuable tool for traders looking to identify significant opening price level of any asset.
Indicator
NAS100
XAUUSD
Breakout
+12
Daily Weekly Monthly - Highs & Lows
Daily/Weekly/Monthly - Highs & Lows Indicator (Customizable Settings)
Indicator
Indices
RSI
Commodities
+1
OrderPrice-V3
A straightforward yet effective tool signals entry points for both buying and selling. Include 3 Moving Average
Indicator
NAS100
Indices
XAUUSD
+8
Market Sentiment Pro
Market Sentiment Pro: Predict tops & bottoms using crowd psychology. Contrarian signals with 70-80% accuracy. Early Acce
xhobaniFX_ADR-Lines
xhobaniFX_ADR-Lines: Average Daily Range Horizontal Lines
KANDIKA HEAT MAP
Color-Based Market Pressure & Volatility Visualizer The Kandika Heatmap Indicator
Indicator
Breakout
Institutional Flow Radar
Institutional Flow Radar scans the chart for abnormal volume events and classifies them into two groups: Capital &Public
Indicator
Grid
NAS100
NZDUSD
+18
Supertrend Indicator v1.1
SUPERTREND INDICATOR
Indicator
NAS100
NZDUSD
XAUUSD
+10
[Stellar Strategies] Market Session Ultimate
Ultimate Session Tool: Boxes, OR, KZs, PD Levels, Overlaps, Custom Lines & Names, Info Panel! Highly customizable 📉📈
Advanced Market Structure Bos,Choch,SwinLevels, Order Blog
Advanced price action tool that combines multiple technical analysis concepts
SmartArrows AI V2
High-Performance Renko Chart Indicator with Advanced AI Filtering.
Indicator
Grid
NAS100
NZDUSD
+19
Market Strutture Signal Pro
MarketStructureOscSignals is a pure price-action signal tool.
Indicator
NAS100
NZDUSD
Indices
+8
ORB_BRSTrading
This indicator implements an Opening Range Breakout (ORB) trading strategy, designed to capture momentum during the most