
TrendStrengthSignals
Indicator
Version 1.0, Aug 2025
Windows, Mac
5.0
Reviews: 1
Description
A visual toolkit for trend trading that blends a volatility envelope with a cycle-aware channel to show regime, timing, and risk at a glance. It’s designed to be readable on any background (light/dark) and to keep the screen clean while still giving you the “what to do next” hints.
What you see on the chart
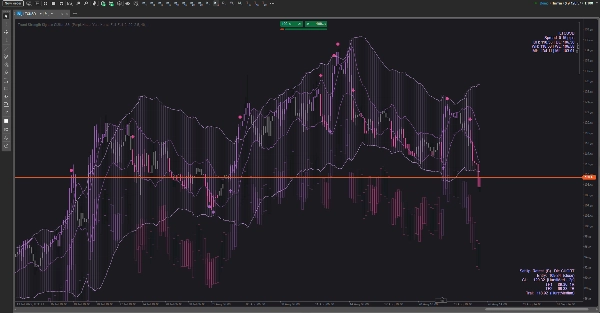
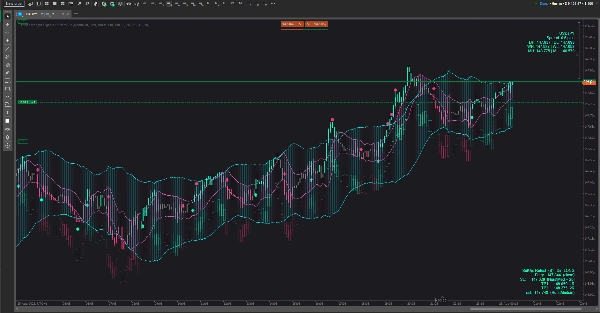
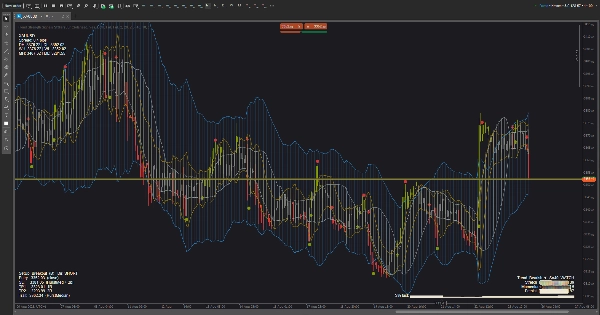
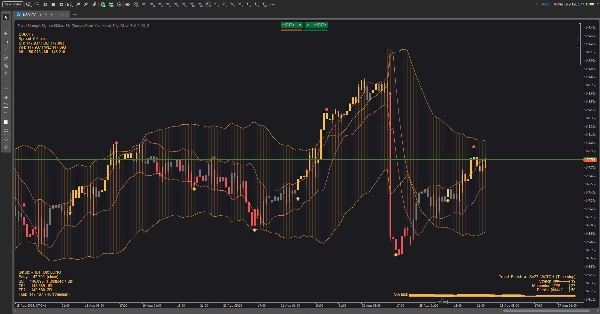
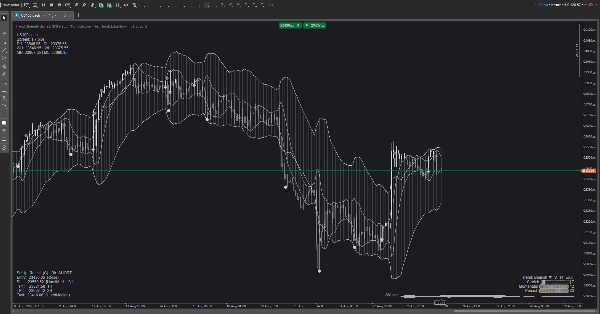
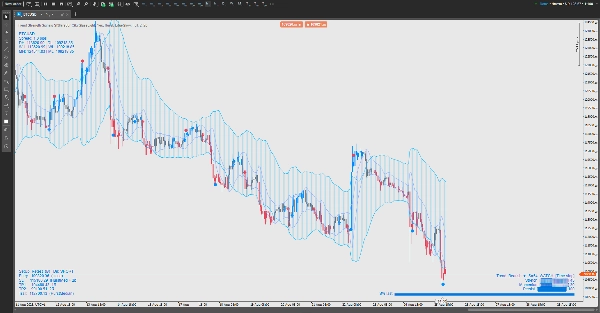
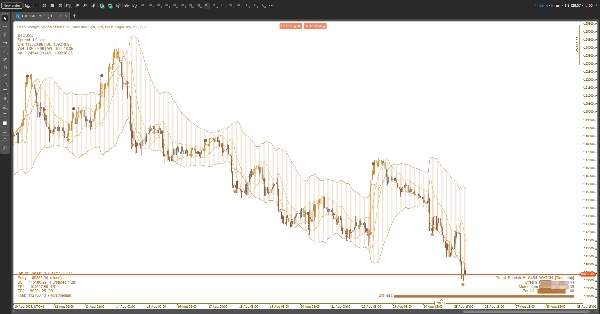
- Clouds (toggleable):
- A volatility cloud that expands/contracts with market activity.
- A cycle cloud that tracks the rolling rhythm of price.
- You can show either, both, or none.
- Signals: unobtrusive up/down arrows for potential trend shifts; small dots for take-profit nudges.
- Trend Strength HUD (three styles):
- Light — a compact status tag.
- Pro — a small dashboard with three meters (stretch, momentum, persistence) plus a mini history sparkline.
- Ribbon — a soft bar near price whose intensity follows trend strength.
- Risk HUD: proposes a direction, a protective stop area, two layered profit targets, and an optional trailing idea. It sits in any corner you choose and updates as the bar evolves.
- Market HUD: symbol & spread, plus day/week/month high–low references, so you always know where you are inside the bigger map.
- Themes: curated color sets for light and dark charts (and a Custom mode). All graphic elements—including HUDs and signals—follow the active theme.
How to use it (practical, not technical)
- Pick your cloud view:
- Use the volatility cloud to see squeezes and expansions.
- Use the cycle cloud to judge “edge” vs “middle” rotations.
- Use both if you want context + timing.
- Read the Trend Strength:
- When the status escalates to HOLD, bias trades with the current direction; when it drops to WATCH, reduce aggression; if it shows EXIT, avoid fresh trades or tighten risk.
- In Pro mode, rising meters + rising sparkline = improving quality; fading meters = manage down risk.
- Time entries with price vs cloud:
- Breakouts after compression, re-entries after a polite pullback to the cloud, or bounces off an outer edge are the staple patterns.
- If an early arrow appears mid-bar and then disappears, wait for bar close confirmation if you prefer fewer head-fakes.
- Manage the trade with the Risk HUD:
- Place the protective stop roughly beyond the nearest structural boundary the HUD highlights.
- Scale out at TP1, let the rest aim for TP2 or follow the suggested trailing line.
- If Trend Strength decays from strong to weak, consider exiting earlier.
- Situational filters:
- Avoid entries when clouds are thin and choppy, or when the strength status sits in EXIT.
- Favor trades when strength is building, the cloud slopes, and price is interacting cleanly with edges.
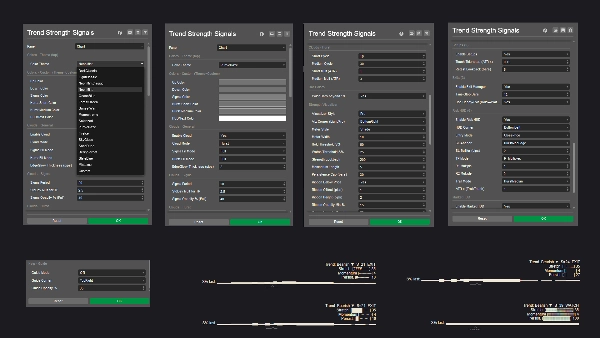
Customization
- Switch HUD corners, visualization style, and color theme to match your workspace.
- Light-friendly themes keep text visible on white backgrounds; ocean/forest/sunset palettes add subtle contrast without glare.
What it’s not
This is not a black-box autotrader. It’s a decision aid: it frames trend quality, proposes sensible risk locations, and highlights high-probability moments—but you stay in control.
Summary
Indicator profile
Customer reviews
5.0
Reviews: 1
5 | 100 % | |
4 | 0 % | |
3 | 0 % | |
2 | 0 % | |
1 | 0 % |
Customer reviews
September 2, 2025
The reason it feels usable is direction is easier to respect, and a 1R exit plan makes review easier.
Discussion
FAQ
Products available through cTrader Store, including trading bots, indicators and plugins, are provided by third-party developers and made available for informational and technical access purposes only. cTrader Store is not a broker and does not provide investment advice, personal recommendations or any guarantee of future performance.


Price
Since 26/05/2025
381M
Traded volume
60.65K
Pips won
14
Sales
1.38K
Free installs