Indicator
NAS100
NZDUSD
XAUUSD
Commodities
Forex
Signal
EURUSD
GBPUSD
BTCUSD
Indices
Prop
ATR
Stocks
Crypto
USDJPY
VSA
"VSA" logo
12/11/2025
Desktop
"VSA" uploaded image"VSA" uploaded image"VSA" uploaded image"VSA" uploaded image"VSA" uploaded image

An advanced, multi-mode volume indicator with three distinct analysis modes. Instantly switch between them to match your trading style.


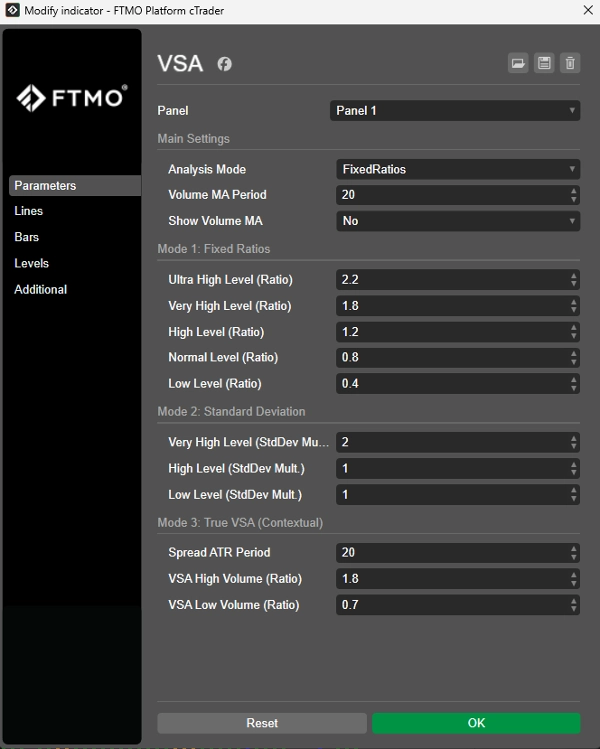
Mode 1: Fixed Ratios

Categorizes volume by comparing it to its moving average multiplied by fixed, user-defined ratios (e.g., 2,0x for "High").

Best for: Traders who prefer manual control and fixed thresholds.


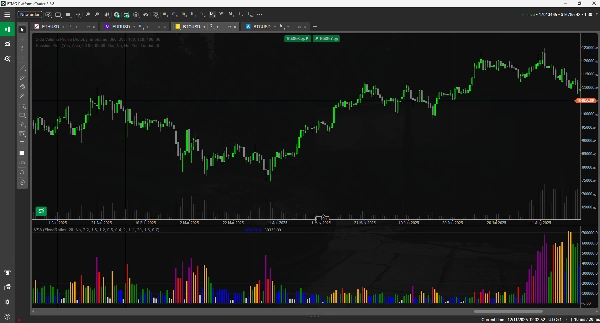
Mode 2: Standard Deviation (Adaptive)

This mode automatically adjusts to market volatility. It categorizes volume based on how many standard deviations it is away from the mean (moving average).

Best for: An adaptive tool that works "out of the box" on any instrument or timeframe.


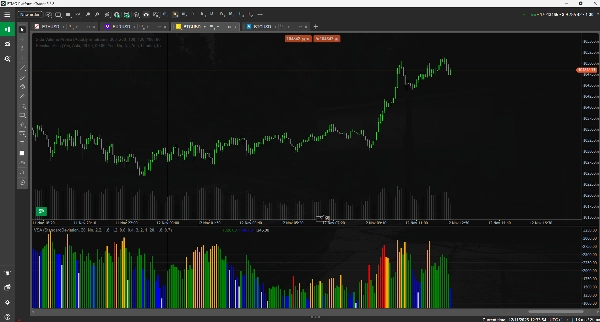
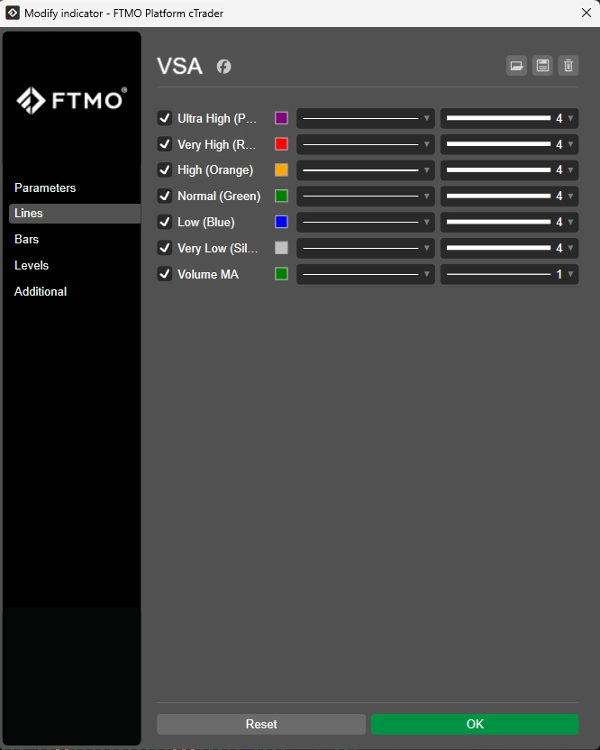
Mode 3: True VSA (Contextual)

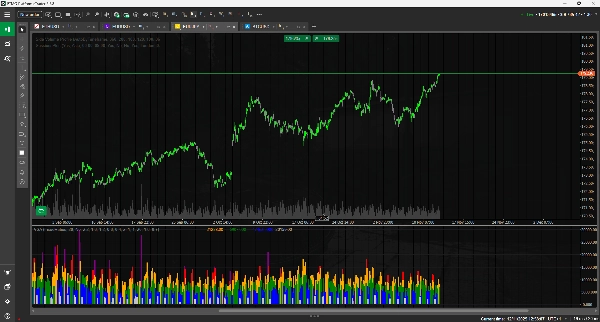
The classic, professional approach. This mode analyzes the context of the bar by combining Volume + Spread (Range) + Close Position to identify key signals.

0.0
Reviews: 0
Customer reviews
No reviews for this product yet. Already tried it? Be the first to tell others!
More from this author
Indicator
NAS100
Indices
Prop
+6
VolumeThermometer
Heatmap of intra-HTF volume (POC/VA) built from LTF tick data; paints current candle and auto-loads visible history.
Side Volume Profile
Right-anchored cTrader Volume Profile with VAH/VAL/POC, LVZ, top volume+EMA, themes, and fast, readable visuals.
Market Entropy
Market entropy + DC. Spot crystallization/chaos shifts with an optional on-chart overlay.
Candles_Painter
Overlay HTF context on any chart: color bars by HTF and draw filled HTF bodies with optional High/Low lines.
Moving Average Plus
10 configurable moving averages: choose type, period, color per line; single price source for all.
TrendStrengthSignals
Edge-aware clouds + Pro HUD: better entries, calmer exits, adaptive risk.
Indicator
NAS100
NZDUSD
XAUUSD
+14
Donchian Channel Pro
Tracks N-period highs/lows, HTF overlay, HUDs with ADX, RSI, session clocks. Customizable for precise trading.
You may also like
Indicator
NAS100
NZDUSD
XAUUSD
+8
Pivot Breakout Detector
🎯 Automatically identify significant breakouts from price consolidation zones.
Indicator
NAS100
RSI
NZDUSD
+19
Bounty stop
the indicator that hunts stop-loss liquidity before the big players do.
Indicator
RSI
Breakout
XAUUSD
+5
Auto-Trend Channel
Adaptive trend channel using linear regression and Pearson correlation for dynamic support, resistance, and trends.
Indicator
Breakout
BreakOut_Probability_Expo
Break Out Probability Experimental indicator. Credits for this indicator goes to Zeiierman !!!
Indicator
Indices
RSI
Signal
+1
[Stellar Strategies] QQE
The QQE indicator is a technical analysis tool designed to identify potential trend changes and trading signals 📈📉
Indicator
NZDUSD
Breakout
FVG
+7
SmartMoneyConceptsIndicator
Automatically displays "Smart Money Concepts" used by professional traders.
DynamicVolumeSupplyDemand
Supply and Demand Zones
VegaXLR - Chart Patterns Alerts
Enhance your trading strategy with automated detection and alerts for key chart patterns.
Indicator
Indices
XAUUSD
Commodities
+8
ATR on Chart
Plots the ATR on the chart for easy visualization.
Indicator
RSI
EURUSD
MACD
Supply&Demand
Precision Supply & Demand zones indicator—automatically plots key buy/sell areas on your chart for smarter entries.
Market Sessions Advanced
Advanced Market Sessions with ICT killzones
Market_Session_Forex
Market Sessions
Indicator
Grid
Breakout
XAUUSD
+10
Ultimate Trend ADX
Download Ultimate Trend ADX today and experience a smarter way to track market trends completely free on ctrader
Decision Point
Decision Point
Indicator
XAUUSD
Commodities
ATR
+1
[Stellar Strategies] Visual Trend Momentum
Visual Trend Momentum is a MA/ATR/Volume trend tool. Visual signals for strong trends & reversals. Customizable. 📈📉
Open Trade PipsV1
This indicator tracks the unrealised amount of pips in your open positions.
Indicator
Indices
FVG
Commodities
+4
FAIR VALUE GAP INDICATOR
Pinpoint FVGs, track fills and see mitigation stats — trade imbalances with clarity and confidence.
HTFBB
Plot higher-timeframe Bollinger Bands for clearer structure, pullback zones, and breakout signals—without switching char